Two research houses read the same benchmark graph the same week and reached diametrically opposite conclusions. One sees a scenario (not base case) of the beginning of a structural economic catastrophe. The other sees a technology adoption story unfolding exactly as history would predict. Both are armed with data. Both are credible. And the resolution of their argument may be the most consequential macro question of the decade for CFOs, corporate boards, and policymakers.
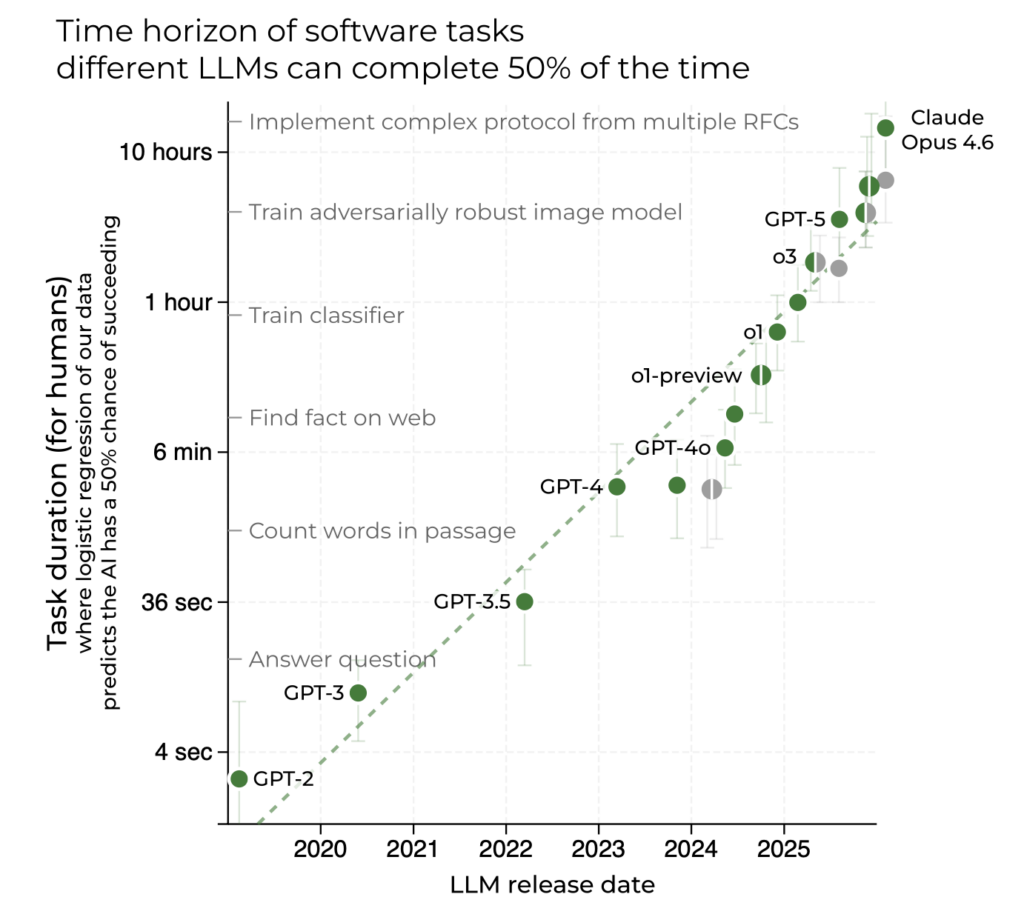
The graph at the center of the debate is METR’s ‘time horizon plot’, a benchmark measuring how long it takes human experts to complete tasks that frontier AI models can successfully perform. Released in January 2026, METR’s updated data (Time Horizon 1.1) delivered a jarring finding: the doubling rate of AI task capability has accelerated from every 7 months historically to every 4.3 months since 2023. As of late February 2026, Claude Opus 4.6 has a 50% time horizon of 14.5 hours. The trend line, if extrapolated, points to month-long autonomous projects before the end of the decade. See graph below.
Citrini Research ran with that extrapolation and published ‘The 2028 Global Intelligence Crisis,’ a scenario memo written from the imagined perspective of June 2028 — with the S&P 500 down 38%, unemployment at 10.2%, and a private credit system cracking under the weight of defaulted PE-backed software loans. Citadel Securities fired back two days later with ‘The 2026 Global Intelligence Crisis,’ a data-driven rebuttal arguing that capable technology and adopted technology are not the same thing, and that the historical record offers no warrant for assuming they soon will be.
For executives making capital allocation, workforce planning, and competitive strategy decisions today, understanding exactly where the two pieces agree is not optional.
Why AI’s 2026 Capability Surge Matters for Every Corporate Leader
- The METR AI benchmark is accelerating — not slowing. METR’s January 2026 Time Horizon 1.1 update revised the AI capability doubling time from 7 months to 4.3 months post-2023. The current best-performing model (Claude Opus 4.6) sits at a 14.5-hour time horizon. The direction of AI capability growth is not in dispute.
- Adoption data tells a different story than capability data. The St. Louis Fed Real Time Population Survey shows daily AI use for work as ‘unexpectedly stable’ with no visible non-linear inflection — the signal you would need to see before declaring imminent labor displacement. But surveys don’t necessary capture usage.
- White-collar anxiety is running at generational highs. The University of Michigan Survey of Consumers shows high-earner labor market confidence near lows not seen since the late 1970s. The New York Fed’s consumer survey shows unemployment anxiety at record levels. Stanford data finds a 16% drop in employment among early-career workers in AI-exposed occupations since 2022.
- CFOs are already making the substitution calculation. JPMorgan’s CFO publicly told analysts the firm is deprioritizing hiring as AI is deployed across the business. Remember, JPM should be seen as a tech company as they commit $18 billion a year for technology. Fortune 500 procurement teams are leveraging AI capability as pricing leverage in SaaS renewals. The behavioral shift is measurable, even if the macro signal is not yet decisive.
- The policy and fiscal system was not built for this transition. The U.S. federal government’s revenue base is essentially a tax on human labor. If productivity gains flow to capital and compute rather than wages, the fiscal architecture faces structural stress independent of GDP growth.
The Adoption-Capability Gap: A Framework for Decision-Makers
The most useful lens through which to analyze this AI economic debate is what I call the Adoption-Capability Gap. This is the distance between what AI systems can demonstrably do in 2026 and what economic actors are actually deploying at scale. Understanding whether that gap is narrowing, and at what speed, is the pivotal strategic variable for workforce planning and capital allocation decisions.
“Recursive capability does not imply recursive adoption.” — Citadel Securities, February 2026
Citadel’s argument rests on a well-established historical pattern: technological diffusion follows an S-curve. Early adoption is slow and expensive. Growth accelerates as costs fall and complementary infrastructure develops. Saturation sets in as diminishing returns emerge and organizational integration costs accumulate. The firm’s data shows generative AI workplace adoption tracking similarly to the early PC and internet adoption curves, but not ahead of them.
Citrini’s counter is that this time the S-curve logic may not hold, for one specific reason: AI improves at the very tasks humans would redeploy to. When the ATM arrived, bank tellers shifted to relationship banking. When the internet disrupted travel agencies, new digital marketing roles were created. Every prior transition generated new categories of human-required work. The Citrini scenario posits that a general-purpose intelligence that improves recursively closes off those adjacent redeployment paths and makes the S-curve argument structurally inapplicable.
Ask yourself why Stanford found a 16% drop in early-career employment in AI-exposed occupations since 2022, even as overall unemployment remained historically low. The data does not resolve the debate but it suggests the Adoption-Capability Gap is narrowing faster at the entry level than aggregate labor statistics reveal. As well, a recent US data release points to an acceleration of productivity which could be an indicator of AI adoption.
What the METR AI Benchmark Actually Measures in 2026 — and What It Doesn’t
METR’s time horizon metric deserves careful parsing before drawing strategic conclusions. The y-axis records the human expert completion time of tasks that a given model can successfully perform at a 50% success rate. It does not measure how long the AI can operate independently. A 14.5-hour time horizon for Claude Opus 4.6 means the model can complete tasks that take human experts roughly 14.5 hours, but this doesn’t it can run autonomously for 14.5 hours without intervention.
The graph is also built almost entirely on software engineering, machine learning, and cybersecurity tasks. MIT Technology Review’s February 2026 review of the benchmark notes this directly: ‘A model can get better at coding, but it’s not going to magically get better at anything else.’ Follow-up METR research suggests time horizons in other domains are also on exponential trajectories, but that work is less rigorous than the core benchmark.
The METR team’s own communications reflect genuine ambivalence about how the graph is being used. Thomas Kwa, one of the lead authors, wrote a January 2026 blog post correcting the most common misreadings. Sydney Von Arx of METR’s technical staff told MIT Technology Review: ‘You should absolutely not tie your life to this graph. But also I bet that this trend is gonna hold.’
The January 2026 Time Horizon 1.1 update added a data point that sharpened the debate: the post-2023 doubling rate of 4.3 months versus the historical 7-month rate. If that acceleration persists, models capable of completing week-long autonomous projects arrive in 2026-2027. Month-long autonomy would follow in 2028-2029. Citrini’s scenario timeline is not arbitrary — it is constructed directly from this acceleration.
The Core Disagreement: How AI Capability Converts to Economic Displacement
Both research houses accept the METR data. Neither disputes that AI capabilities are advancing at an extraordinary rate. The disagreement is entirely about the economic transmission mechanism, how capability becomes displacement, and at what speed.
Citadel’s position: Displacement requires a cost crossover. Displacing white-collar work at scale requires orders of magnitude more compute intensity than current utilization. As automation expands, demand for compute rises, raising its marginal cost. If the marginal cost of compute rises above the marginal cost of human labor for a given task, substitution does not occur. Physical capital constraints, energy availability, regulatory approvals, and organizational change costs create a natural economic boundary. The firm invokes productivity shock theory: AI is a positive supply shock that lowers costs, expands output, and raises real incomes. Prior technological revolutions like steam, electrification, computing, all followed this pattern.
Citrini’s position: The compute cost constraint is dissolving faster than institutions can respond. The marginal cost of an AI coding agent has already collapsed toward the cost of electricity for many software tasks. Unlike prior technology transitions, the productivity gains are not creating new adjacent labor demand at comparable scale — because the new technology improves at the tasks created by the disruption. White-collar workers represent roughly 50% of US employment and drive approximately 75% of discretionary consumer spending. The businesses being disrupted are not peripheral to the US economy. They are the US economy.
Citadel’s Keynes analogy is instructive but cuts both ways. Keynes predicted the 15-hour work week by the early 21st century, getting the productivity forecast right and the labor market implication wrong. He underestimated the elasticity of human wants. Citrini’s implicit rejoinder: elasticity of human wants matters only if there are humans to generate those wants at an economically relevant income level.
Six AI Strategic Planning Lenses for Navigating the 2026 Transition
LENS 1 — WORKFORCE ARCHITECTURE: AI AUGMENTATION VS. HEADCOUNT REPLACEMENT
The question is no longer whether AI will affect your white-collar headcount. It is whether the productivity gains from AI-assisted labor will be redeployed into business expansion or extracted as margin. Companies making that decision in 2026 are shaping the macro environment that determines whether the Citadel or Citrini scenario materializes. Monitor your own ratio of AI-assisted employees to pure headcount replacement with granularity — the aggregate sector data is masking significant dispersion.
LENS 2 — SAAS AND SOFTWARE COST STRUCTURE IN THE AI ERA
The Citrini scenario’s first domino is SaaS pricing power collapsing as AI lowers barriers to in-house builds. This is already observable in procurement negotiations and the stock prices of SaaS companies. If your enterprise tech stack includes significant per-seat SaaS spend, the substitution optionality created by AI coding tools is a real leverage point — whether or not you intend to exercise it. Vendors are aware. Pricing conversations have already changed.
LENS 3 — LABOR INCOME AS DEMAND BEDROCK: THE AI DISTRIBUTION PROBLEM
Citadel’s strongest structural argument is that aggregate demand cannot collapse while GDP is rising without violating national income accounting identities. If output rises, something on the demand side, like consumption, investment, government spending, net exports, must also rise. This is a mathematical constraint, not an optimistic forecast. Track whether productivity-driven margin expansion is being recycled into investment and compensation or concentrated at the compute-ownership layer. The policy response will follow the distribution of gains.
LENS 4 — THE METR AI BENCHMARK AS A PLANNING INDICATOR
For strategic planning purposes, the METR time horizon is best treated as a leading indicator for the scope of tasks that will become economically contestable, not a timeline for labor replacement. A 14.5-hour time horizon means well-specified, self-contained software engineering tasks up to roughly two business days in human effort are now in play. A 40-hour horizon would bring multi-day white-collar project work into that contestable zone. Watch METR’s quarterly updates as a forward-looking signal for which categories of human cognitive labor face credible AI competition in each planning period.
LENS 5 — THE AI REGULATORY WILDCARD: GOVERNMENT AS THE THIRD VARIABLE [NEW]
Neither Citrini nor Citadel fully prices government as a third variable in the adoption equation. If the Citrini scenario begins materializing, policymakers will respond. The EU AI Act is already creating deployment friction in Europe. In the US, mandatory human-in-the-loop requirements, sector-specific AI deployment moratoria, or labor-protective regulation could sharply brake adoption and make the S-curve argument self-fulfilling through a mechanism entirely different from what Citadel envisions.
The critical nuance: regulatory trigger points will likely arrive earlier in the displacement curve than most executives expect. This will be driven by political pressure from the very white-collar workers whose anxiety is already registering in consumer confidence surveys, well before macro data becomes unambiguous. Build regulatory scenarios into your workforce and technology roadmaps now, not after the first major policy intervention. The pace of capability advancement is now fast enough that a single regulatory cycle could become a meaningful adoption brake.
LENS 6 — SECTOR-LEVEL AI DISPLACEMENT: EARLY WARNING INDICATORS
The article identifies METR as a leading indicator at the capability level. At the deployment level, watch the sectors already showing measurable displacement: insurance underwriting, legal document review, financial analysis, and junior software QA. These are not peripheral to the economy as they are the white-collar bellwether industries whose employment and billing trends will validate or refute which scenario is actually unfolding, ahead of aggregate labor statistics.
Employment headcount, billing rates, and graduate hiring data in these sectors over the next four to six quarters constitute a real-time scorecard. If insurance underwriting headcount contracts 10% while AI-assisted claim processing volumes double, the Adoption-Capability Gap is narrowing faster than headline data reveals. These sector-level signals will give corporate leaders 12 to 18 months of advance warning before the macro picture clarifies. They are available now, in earnings calls, industry association surveys, and university placement data.
The Question That Will Determine AI’s Economic Impact on Your Organization
The Citadel-Citrini debate resolves to a single empirical question that no one can currently answer with confidence: Does the Adoption-Capability Gap close gradually, following the historical S-curve that has governed every prior technological transition, or does it close in a step-function as agentic AI systems cross the threshold of economic viability for white-collar task replacement at scale?
The METR data accelerating from a 7-month to a 4.3-month doubling rate does not answer that question. Citadel’s adoption surveys showing stable daily AI use for work do not answer it either. What it suggests is that we are likely in the early phase of the S-curve, a period that looks linear before it isn’t.
The question isn’t whether AI can do your job. It’s whether the economics of deploying it at scale will cross the threshold before your organization has adjusted.
History is Citadel’s ally. The capability curve is Citrini’s. In every prior technological transition, history won. The case for this one being different rests on a single, genuinely novel condition: for the first time, the most productive asset in the economy improves at the very tasks the economy would create to absorb the workers it displaces.
Whether that condition is sufficient to break the historical pattern is the defining AI economic question of the decade.
SOURCES & FURTHER READING
METR Time Horizon 1.1 (January 2026): metr.org/blog/2026-1-29-time-horizon-1-1/
MIT Technology Review — “This is the most misunderstood graph in AI” (Feb 2026): technologyreview.com
Citrini Research — “The 2028 Global Intelligence Crisis” (Feb 22, 2026): citriniresearch.com/p/2028gic
Citadel Securities — “The 2026 Global Intelligence Crisis” (Feb 24, 2026): citadelsecurities.com
Epoch AI — METR Time Horizons benchmark tracker: epoch.ai/benchmarks/metr-time-horizons