Executive Summary
The Iran war represents the most consequential geopolitical shock to global energy markets since the 1973 oil embargo. In ten days, Operation Epic Fury has killed Iran’s Supreme Leader, effectively closed the Strait of Hormuz and upended the geopolitical balance in the region. Most people think of the SoH as the chokepoint for 20 million barrels per day of oil and LNG. But several other critical commodities and raw materials flow through the narrow straight. The closure elevated Brent crude from $72 to over $100 a barrel and upset prices for European and Asian natural gas, fertilizer, LPG, etc. Iran has responded to the attacks by selecting its most hardline leader in a generation, Mojtaba Khamenei, who has vowed to fight on and warned of a $200 price tag on a barrel of oil.
This report provides decision-makers with a probability-weighted scenario framework, a four-phase market timeline, historical war market precedents, sector-specific corporate implications, and an executive action framework. The goal is not to predict the outcome, but to give leaders a structured way to plan and act under genuine uncertainty.
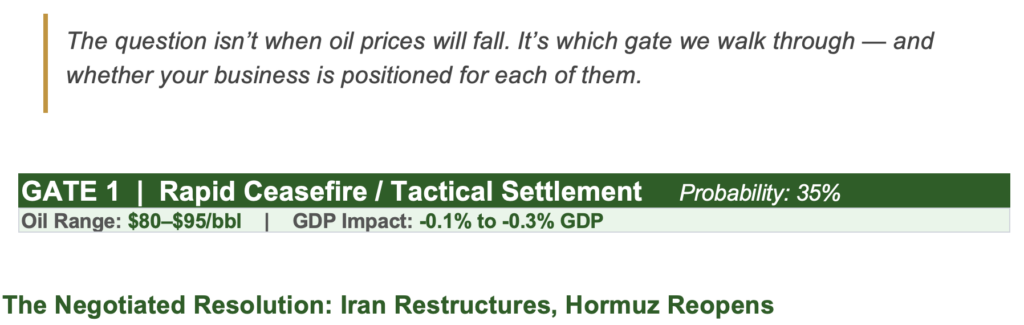
The central conclusion: the economic consequences of this conflict are likely to persist regardless of military outcome, because sustained geopolitical risk premiums, energy-market fragility, and strategic realignment are already underway. The question is not whether your business is affected. It is whether your planning horizon matches the most likely scenario.
Why This Matters to Your Business
• Oil near $100 is already a tax on global operations. — Every $10/bbl increase in sustained crude prices translates to approximately 0.1–0.2 percentage points of additional global inflation. At current levels, corporate transportation costs, logistics contracts, and energy inputs are repricing this week. Not next quarter.
• The Strait of Hormuz carries one-fifth of global oil — and it is not fully open. Ask yourself why Saudi Aramco is simultaneously loading supertankers at its Red Sea terminals right now. The Saudi East-West bypass pipeline handles at most 5 million barrels per day; the UAE bypass adds another 2 million. Normal Hormuz traffic is 20 million barrels per day. There is no quick engineering fix for the 13-million-barrel daily gap.
• Qatar’s LNG — nearly 20% of global supply — is at force majeure. QatarEnergy declared force majeure on March 4 following a drone strike on Ras Laffan. European gas storage sits at just 30% of capacity entering summer, the critical refilling season. One month of halted Qatar and UAE supply removes 7 million tonnes of LNG from the market. A disruption beyond 30 days eliminates the LNG oversupply the world was counting on for 2027–2028.
• Iran’s new leadership signals no near-term off-ramp. Mojtaba Khamenei, 56, has deep IRGC ties and has pledged to maintain continuity — ‘including in the war,’ per Bloomberg Geoeconomics. Tehran’s stated position: it can sustain the current war intensity for at least six months. Back-channel CIA contacts exist, but who can credibly commit Iran to any agreement is genuinely unclear.
• The regional contagion is already broader than most models assumed. Bahrain has declared force majeure and reported a damaged desalination plant. The US has ordered non-essential diplomats out of Saudi Arabia. Iranian drone attacks have targeted Aramco’s Shaybah field. Saudi Arabia and the UAE are walking a tightrope and routing oil via bypass pipelines while managing the risk those pipelines become targets.
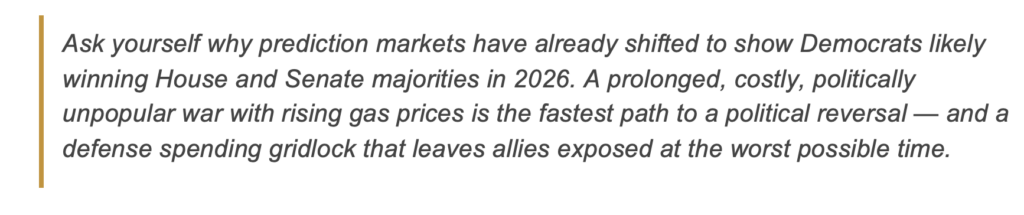
• US political pressure is building faster than the military timeline. Some prediction markets now show Democratic majorities in both chambers as the most likely 2026 midterm outcome, a reversal from just weeks ago. A split party control could gridlock US defense spending, a real risk given polling on support for the war. Trump faces mounting domestic pressure as diesel and gasoline pump prices surged last week, with $100 oil already politically toxic.
Probability-Weighted Strategic Scenarios
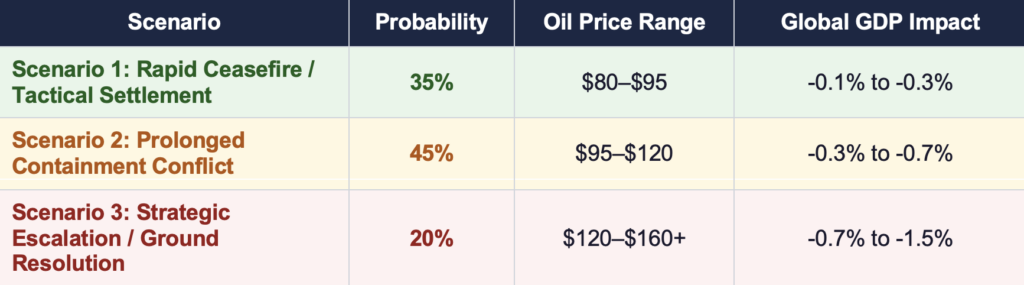
The three scenarios below represent the principal pathways from the current conflict. Probabilities reflect a synthesis of multiple scenarios and should be seen as estimates, not empirically grounded forecasts. These are not predictions; they are planning probabilities that should be weighted and stress-tested against your specific business exposure.
The Three Gates Framework
Every major geopolitical crisis involving energy has an endgame logic or a set of preconditions that must be met before markets can normalize. I call these conditions Gates. Each gate leads to a fundamentally different economic and market environment. Understanding which gate is most likely, and how quickly signals will confirm or deny it, is the core analytical challenge for executives right now.
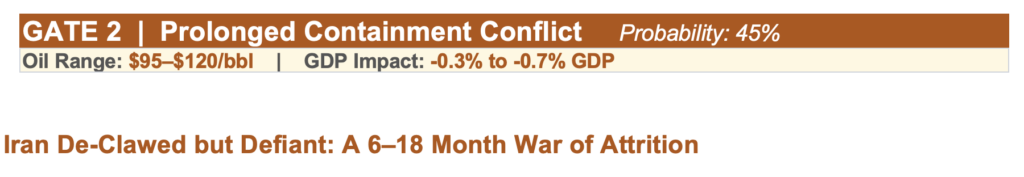
The best-case scenario is not a fairy tale — it has a narrow but real pathway. Iran’s surviving intelligence apparatus apparently has already made quiet back-channel contact with the CIA through a third-country intermediary. President Trump has signaled openness to a Venezuela-style outcome: a restructured Tehran government that cooperates with US demands rather than full regime collapse. He stated on March 1 that renewed nuclear talks would be ‘much easier’ given military success against Iran.
In this scenario, a combination of military degradation, economic pressure from China (Iran’s largest oil customer, which has already called for ‘unfettered shipping’ through Hormuz), and diplomatic brokerage produces a negotiated framework within 2–4 weeks. Iran’s nuclear program is verifiably frozen or dismantled. A pragmatic new government accepts a ceasefire. The IRGC is significantly weakened but not fully disbanded. The Strait of Hormuz reopens under US naval escort.
What enables this: Iran has approximately 155 million barrels of crude stored at sea — roughly 100 days of exports pre-positioned outside the strait. That buffer creates a window for negotiation before Tehran’s export revenue collapses entirely. China’s leverage over Iran is genuine and powerful: Beijing is Tehran’s primary oil buyer and has signaled it will not provide weapons.
Market trajectory: Brent crude normalizes to $80–$95/bbl within 60 days of a credible agreement. The G-7 coordinated reserve release (300–400 million barrels) successfully bridges the gap. LNG markets stabilize by Q3 2026. Defense stocks plateau after an initial run-up. Global GDP impact is limited to -0.1% to -0.3%.
Watch for: Confirmed second-round back-channel talks. Trump publicly defining what ‘unconditional surrender’ means. Chinese diplomatic pressure on Tehran. Any Iranian statement that softens the public posture of new Supreme Leader Mojtaba Khamenei.
It is the most likely outcome based on available evidence. US and Israeli strikes successfully destroy Iran’s long-range missile capability and degrade the IRGC’s industrial base. But the IRGC itself does not surrender, and no coherent opposition force emerges to replace the regime.
Iran transitions into a fractured internal conflict. Some version of theocratic governance persists, but power is contested and decentralized. Drone attacks on Gulf infrastructure become chronic, though declining in sophistication as weapons stockpiles deplete. The Strait of Hormuz reopens partially, under US naval escort, but war-risk premiums on Gulf shipping remain structurally elevated.
The critical variable is duration. Tehran has stated it can sustain the current war intensity for six months. The Saudi and UAE bypass pipelines can route up to 7 million barrels per day around Hormuz — barely a third of normal traffic. OECD emergency stockpiles hold 90 days of consumption. The US Strategic Petroleum Reserve carries over 400 million barrels. These are finite buffers against an indefinite conflict.
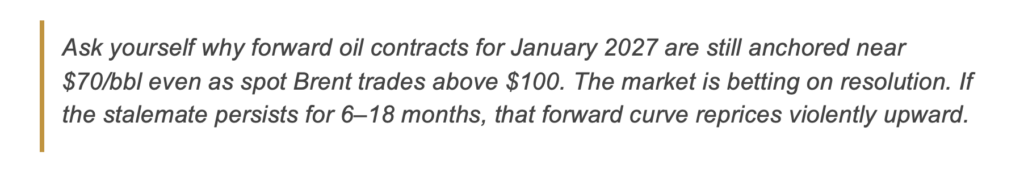
The stalemate scenario looks different from the outside than it feels inside for businesses. Markets may appear to stabilize at elevated levels — $95–$120/bbl oil becomes the ‘new normal.’ But beneath the surface: Qatar’s LNG expansion is delayed by at least a year, Gulf shipping insurance premiums are structurally repriced, and European energy storage enters the critical summer refilling season at dangerously low levels.
Market trajectory: Elevated oil ($95–$120/bbl) persists for 6–18 months. LNG spot prices spike in Europe ahead of the 2026–27 winter. Counter-drone, missile interceptor, and electronic warfare manufacturers see sustained demand. Global GDP takes a -0.3% to -0.7% hit.
Watch for: Drone attack frequency on Saudi, UAE and other critical energy infrastructure, the pace of Iran’s missile depletion versus US/Israeli weapons inventory levels, and whether US domestic gasoline prices force a political inflection point driving a negotiated exit.
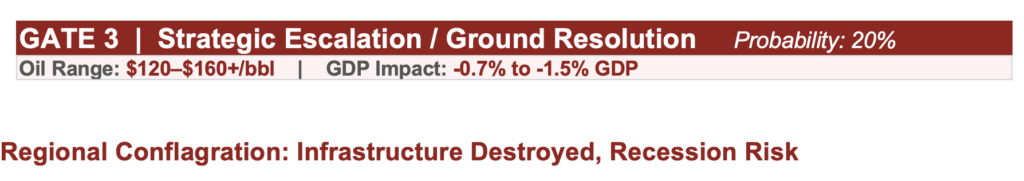
The worst-case scenario requires a specific chain of events not yet in motion — but every ingredient is present. It begins with Iran successfully striking the Saudi East-West pipeline, the UAE’s Fujairah terminal, or the Ras Laffan LNG complex with sustained, damaging attacks that exceed the capacity of pipeline bypasses. Compounding factors: Russia provides active intelligence or China provides diplomatic cover rather than pressure toward peace.
In this scenario, Brent crude breaks above $130–$160+/bbl — approaching in real terms the 2008 spike that helped trigger the financial crisis. EU gas storage fails to refill adequately before winter 2026–27. Asian refineries cut operating rates in cascading shutdowns. Inflation becomes structurally embedded, forcing central banks to reverse rate-cutting cycles just as growth decelerates — precisely the 1973 analog.
The regional chain reaction matters most. Hezbollah has already resumed hostilities with Israel. The Houthis, who paused after the Israel-Hamas ceasefire, have warned they will re-enter if Iran is attacked — they now have every justification. Bahrain’s desalination plant has been hit. Saudi Arabia’s Shaybah oil field was targeted March 9. One successful large-scale infrastructure strike could shift this from a spike to a structural supply loss.
The defense and strategic implications are far-reaching. US military planners are already reassessing Taiwan contingencies based on what they are observing in real time: decapitation strikes, drone warfare tactics, missile defense vulnerabilities, and the limits of interceptor stockpiles. The destruction of TPY-2 radar systems in Jordan is a specific lesson being absorbed by every Pacific commander right now.
Market trajectory: Oil $130–$160+/bbl, possibly higher if infrastructure is materially damaged. LNG spot at multi-year highs through 2027. Global equities reprice a recession scenario. Investment-grade credit spreads widen. Dollar strengthens as a haven at the cost of global trade volumes. Any 2026 corporate strategy built on Gulf energy assumptions requires immediate revision.
Watch for: Successful Iranian strikes on Saudi or UAE pipeline infrastructure. Any confirmed Chinese weapons transfer to Iran. Houthi re-entry into Red Sea attacks. Failure of the G-7 strategic reserve coordination. US special forces deployment signals around Iran’s near-bomb-grade uranium stockpile.
Market Timeline Model: Four Phases
Regardless of which gate we walk through, the conflict will move through a predictable sequence of market phases. Understanding where we are in this timeline is as important as knowing which scenario is unfolding.
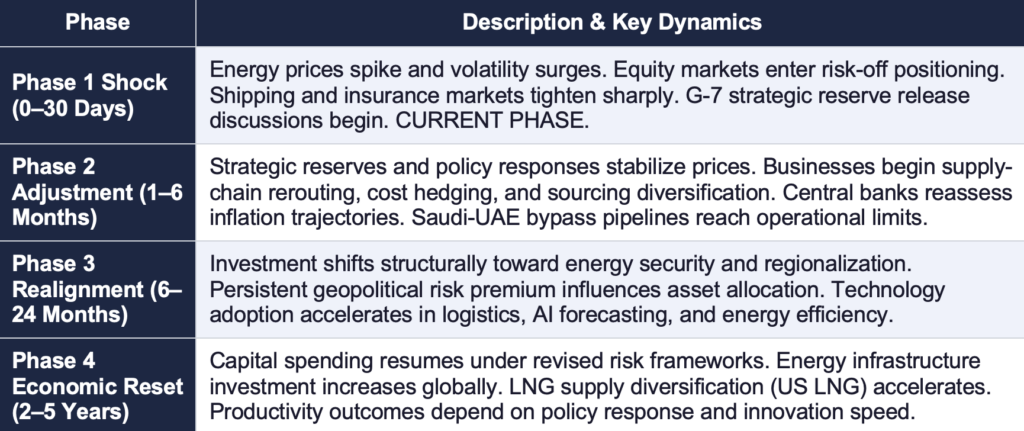
We are currently in Phase 1. The G-7 is coordinating a potential 300–400-million-barrel strategic reserve release. Saudi Arabia and the UAE are maxing out bypass pipeline capacity. The critical question for the next 30 days is whether Phase 2 adjustment becomes orderly — or whether a Phase 3 infrastructure strike skips directly to a more severe reset.
Historical War Market Performance: What the Data Shows
Markets often react more sharply to uncertainty about escalation than to the outbreak of conflict itself. In many major geopolitical episodes, US equities sold off quickly during the initial shock phase, then recovered once investors gained confidence that the conflict would remain geographically contained and energy flows would stabilize. The pattern is not uniform — and the current conflict does not map cleanly to any single historical analog.
The most important variable across all historical episodes is the oil channel. Conflicts that trigger an energy embargo or lasting supply impairment produce larger, more persistent market losses than conflicts resolved quickly with limited energy disruption. The current Iran war uniquely combines both risks: an immediate supply shock through the Hormuz closure and a latent escalation risk that could impair Gulf infrastructure for years.
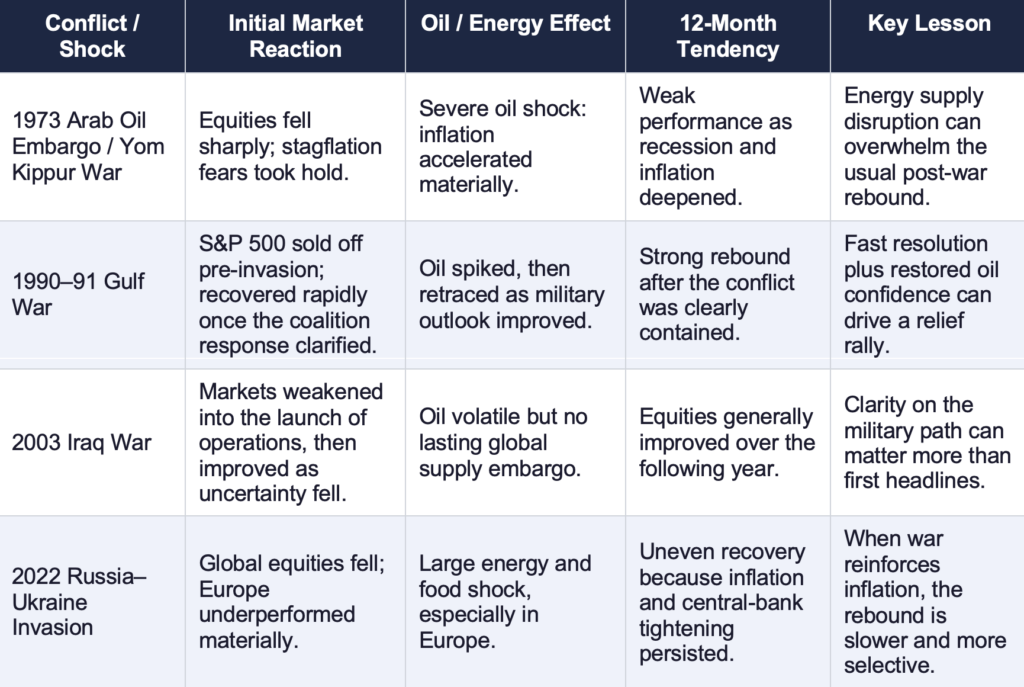
For the current Iran war, the most useful historical comparison is a hybrid: the Gulf War’s short-term oil sensitivity combined with the Russia-Ukraine war’s inflation persistence. If Hormuz disruption is brief (Gate 1), equities could recover in a pattern like 1991. If the conflict embeds a lasting energy and shipping premium (Gate 2 or Gate 3), market performance is more likely to resemble the uneven, policy-constrained environment of 2022 — where the rebound was slow, selective, and ultimately constrained by central bank tightening.
Quantified Macroeconomic Impact Ranges
The economic effects of the Iran conflict will transmit through four primary channels: energy prices, shipping costs, financial conditions, and confidence. The magnitude depends critically on duration and scenario.
Inflation channel: Oil sustained near $100/bbl could raise advanced-economy inflation by approximately 0.5–0.8 percentage points over a 12-month horizon. A severe escalation with oil at $130–$160+ could push inflation impacts above 1.0–1.5 percentage points, potentially forcing central banks to reverse rate-cutting cycles — the most damaging macro-outcome for leveraged companies and real estate.
Growth channel: Global GDP growth could be reduced by 0.3–0.6 percentage points in the base case (Gate 2) over a 12-month horizon. A severe escalation scenario (Gate 3) pushes that impact to -0.7% to -1.5% — sufficient to tip several European economies into recession, particularly those with low gas storage and high energy import dependency.
LNG-specific: If Qatar and UAE supply is halted for more than 30 days, the LNG oversupply anticipated for 2027–2028 disappears entirely. Europe enters the 2026–27 winter refilling season at 30% storage capacity — a critical vulnerability. Spot LNG prices could spike to levels last seen during the 2022 European energy crisis.
Rapid stabilization: In Gate 1, macro effects are limited to temporary volatility and modest growth drag (-0.1% to -0.3%). Markets recover in a 1991-style pattern. The G-7 reserve release and bypass pipeline utilization prove sufficient to bridge the disruption window.
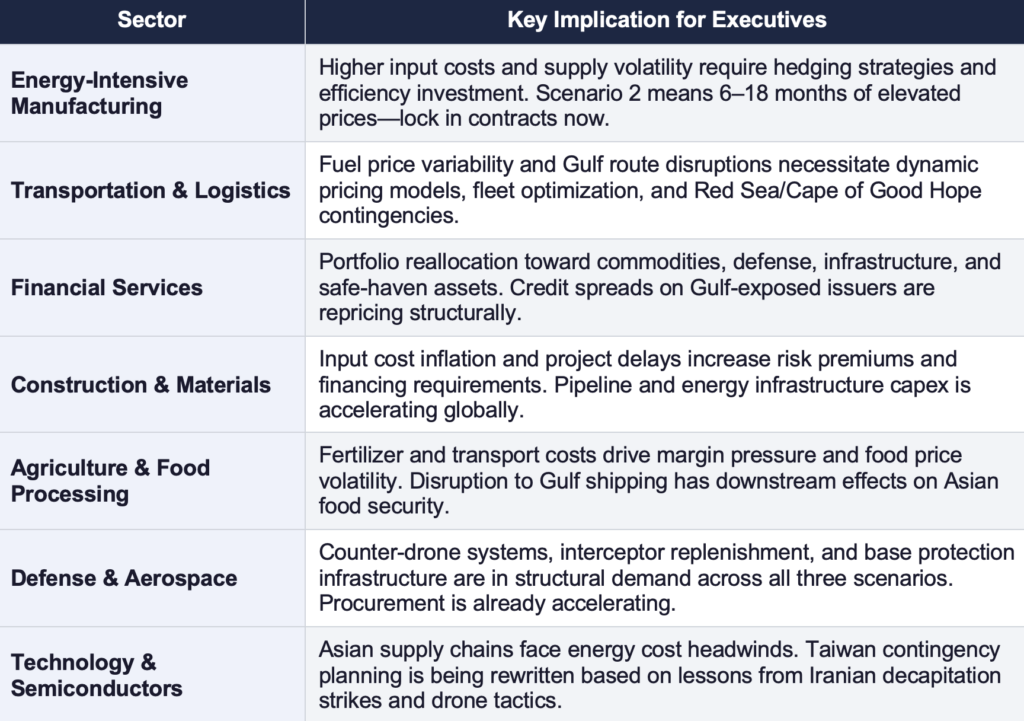
Sector-Specific Corporate Implications
The Iran conflict will not impact all industries equally. The table below summarizes the key strategic implication for each major sector under the base-case scenario (Gate 2: Prolonged Containment). Gate 1 relief reduces the severity; Gate 3 escalation amplifies it.
Three Planning Lenses for Executive Teams
Lens 1: Energy Costs Are Already Repriced — Plan for Duration, Not Normalization
At $100+/bbl, the energy cost shock is not hypothetical. It is in this week’s supplier invoices and next month’s logistics contracts. The question for finance leaders is not whether to hedge — it’s whether current hedges cover 60 days or 18 months of elevated prices. The base case (Gate 2) means planning for oil above $95/bbl through at least the end of 2026 is prudent, not pessimistic. Companies that lock in 12-to-18-month energy contracts in the next 30 days will have a structural cost advantage over those who wait for ‘clarity.’
Lens 2: Gulf Supply Chain Risk Is Structural, Not Temporary
Companies that source materials, components, or finished goods through the Gulf — or that have suppliers with Gulf energy exposure — must map second-order risks now. War-risk insurance premiums for Gulf shipping have already spiked. QatarEnergy’s force majeure is not a 30-day event if the stalemate persists. Supplier diversification timelines measured in ‘quarters’ need to be compressed to ‘weeks’ in Gulf-exposed supply chains. The Russia-Ukraine analog is instructive: companies that had begun diversifying in January 2022 had options in March 2022. Those that waited did not.
Lens 3: Defense and Infrastructure Investment Is Accelerating — Selectively
Counter-drone systems, missile interceptors, electronic warfare capabilities, and base protection infrastructure are in structural demand across all three scenarios. The US will replenish depleted weapons inventories. Gulf states will invest heavily in facility hardening. But the longer-term force structure question — what does US military posture look like if Iran is neutralized? — remains open and will reshape procurement priorities in ways not yet priced into defense sector valuations. Technology companies building AI-driven logistics, energy forecasting, and supply chain resilience tools are entering a 5-to-10-year tailwind.
Strategic Corporate Actions
Organizations that integrate the following actions into their planning frameworks in the next 30 days will be better positioned to capture market share and navigate structural shifts — regardless of which gate we walk through.
▪ Diversify suppliers geographically and increase inventory resilience. Build 30-to-60-day buffer stock for Gulf-sourced inputs. Identify alternative suppliers in Western Hemisphere (US, Brazil, Canada, Mexico) now.
▪ Hedge energy and commodity exposure proactively for 12–18 months. The base case (Gate 2) means $95–$120 oil through at least Q4 2026. Spot hedging at current levels locks in better economics than waiting for resolution.
▪ Maintain strong liquidity buffers to absorb cost shocks. The 2022 Russia-Ukraine analog showed that companies with 6+ months of operating liquidity had strategic optionality; those without were forced into distressed refinancing.
▪ Accelerate adoption of AI-driven forecasting and logistics optimization. Dynamic routing, demand sensing, and energy cost modeling are no longer competitive advantages — they are operational necessities in a volatile energy environment.
▪ Expand geopolitical intelligence and scenario-planning capabilities. Build internal capability to monitor the key watchpoints for each gate: Hormuz transit volumes, drone attack frequency on Gulf infrastructure, G-7 reserve release coordination, and Chinese diplomatic signals toward Tehran.
▪ Stress-test capital allocation against all three scenarios. Which investments survive Gate 3? Which only survive Gate 1? Build a decision matrix that allows the board to act quickly when the scenario becomes clearer.
Conclusion
The Iran War began over ten days ago, and it has already permanently altered the global energy and geopolitical landscape. Ayatollah Khamenei is dead. A hardline successor has been chosen and is vowing to fight. Brent crude is above $100. The Strait of Hormuz is functionally closed. Qatar has declared force majeure. US diplomats are leaving Saudi Arabia. These facts are not in dispute.
What is in dispute is how this ends. The Three Gates framework gives executives a structured way to navigate genuine uncertainty. Gate 1 (35%) requires back-channel diplomacy to succeed quickly. Gate 2 (45%, base case) requires managing an elevated, volatile energy environment for 6–18 months while Iran’s power-projection capacity is systematically degraded. Gate 3 (20%) requires a chain of escalations — successful infrastructure strikes, third-party involvement, political collapse in Washington — that are individually possible and collectively dangerous.
History offers a clear lesson: the companies that built scenario-planning capability before the Russia-Ukraine war in 2022 had options in March 2022. Those that waited for certainty did not. The parallel holds today. The next 30 days are a planning window, not a waiting window.