Climate change is considered by many to be the greatest challenge in modern history. As global temperatures increase, countries are faced with numerous natural disasters, including severe droughts, floods, cyclones, heatwaves, wildfires, and rising sea-levels. Climate disasters appear to only keep getting worse, and there is therefore an urgent need for a significant reduction in global greenhouse gas (GHG) emissions. In the most devastating of catastrophes last August, an extreme flood drowned almost one-third of Pakistan’s land, killing thousands, displacing millions, and destroying homes everywhere. If we do not start acting now, the future will hold multiples of similar Pakistan cases, if not even worse.
As more countries align their policies for climate action, pledges for the reduction of emissions are committed by nations and corporations. One of the most efficient methods to encourage these reductions is to put a price on carbon, which can be achieved through carbon markets. The development and growth of carbon markets will play a critical role in closing the gap between pledges and action.
The map below shows the Emissions Trading Systems (ETS), or carbon markets, already implemented or scheduled for implementation (green) or under consideration (yellow). While carbon markets are more developed in a few regions, including Europe, North America, and some Asian countries, many parts of the World, including Africa and other developing countries, still lag well behind.
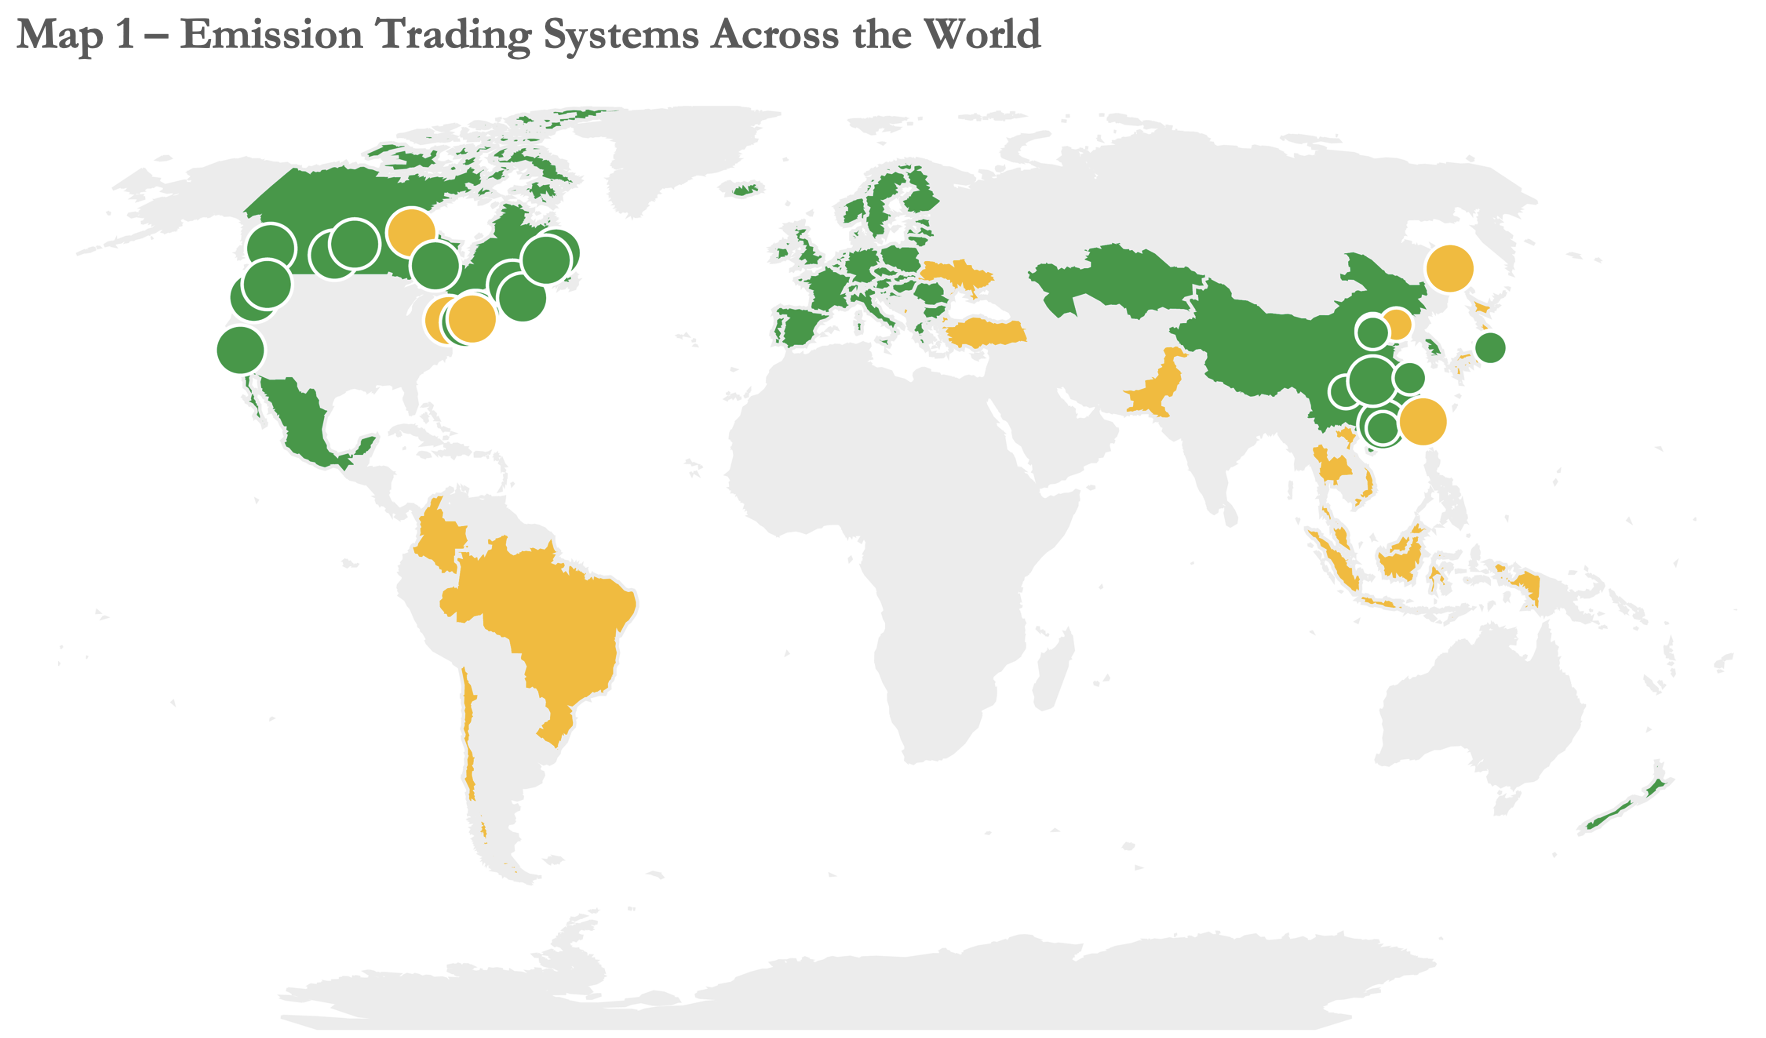
Source: The World Bank Carbon Pricing Dashboard.
This article explores what carbon markets are, their types, and their role and potential for reducing carbon emissions. Carbon markets are an integral part of the fight against climate change. However, while the traded value and volume of carbon markets have significantly grown over the years, there is tremendous room and opportunity for improvement. Carbon markets are yet to be developed in a wider range of countries, with carbon credits traded across borders and more sectors included. Moreover, significant efforts are needed to expand and develop voluntary carbon markets and tap their full potential.
What Are Carbon Markets and How Do They Work?
Carbon markets are trading mechanisms that enable the buying and selling of carbon credits, such as carbon allowances or offsets. They make it possible to directly control the quantity of greenhouse gases emitted. A single tradable carbon credit is issued for one metric ton of reduced, sequestered, or avoided carbon dioxide or an equivalent amount of other greenhouse gas emissions (GHG). Carbon markets aim to support countries in mitigating climate change, through pricing emissions, by turning them into tradable commodities. This creates incentives for emissions reduction, by penalizing high emitters while rewarding low emitters. The key mechanisms are putting a price on carbon or limiting the amount of carbon a company or sector is allowed to emit. The more you limit the amount of carbon allowed, the higher the value of a traded credit. The higher the price or tax on carbon, the higher the value of a traded credit.
There are generally two types of carbon markets: compliance markets and voluntary markets. While compliance carbon markets are created and regulated by national, regional, or international regulators and involve mandatory participation in the trading of carbon allowances, voluntary markets are initiatives that involve the trading of carbon offsets by institutions on a non-compulsory basis., usually to meet their own objectives.
Compliance Carbon Markets (CCT)
Compliance or mandatory carbon markets are regulatory frameworks, through which institutions are required by law to limit and account for their GHG emissions. The typical case of a compliance carbon market is the “cap-and-trade” system. Under such a system, the government sets a maximum limit or “cap” for the total emissions of certain sectors, then distributes “carbon allowances” to govern emissions.
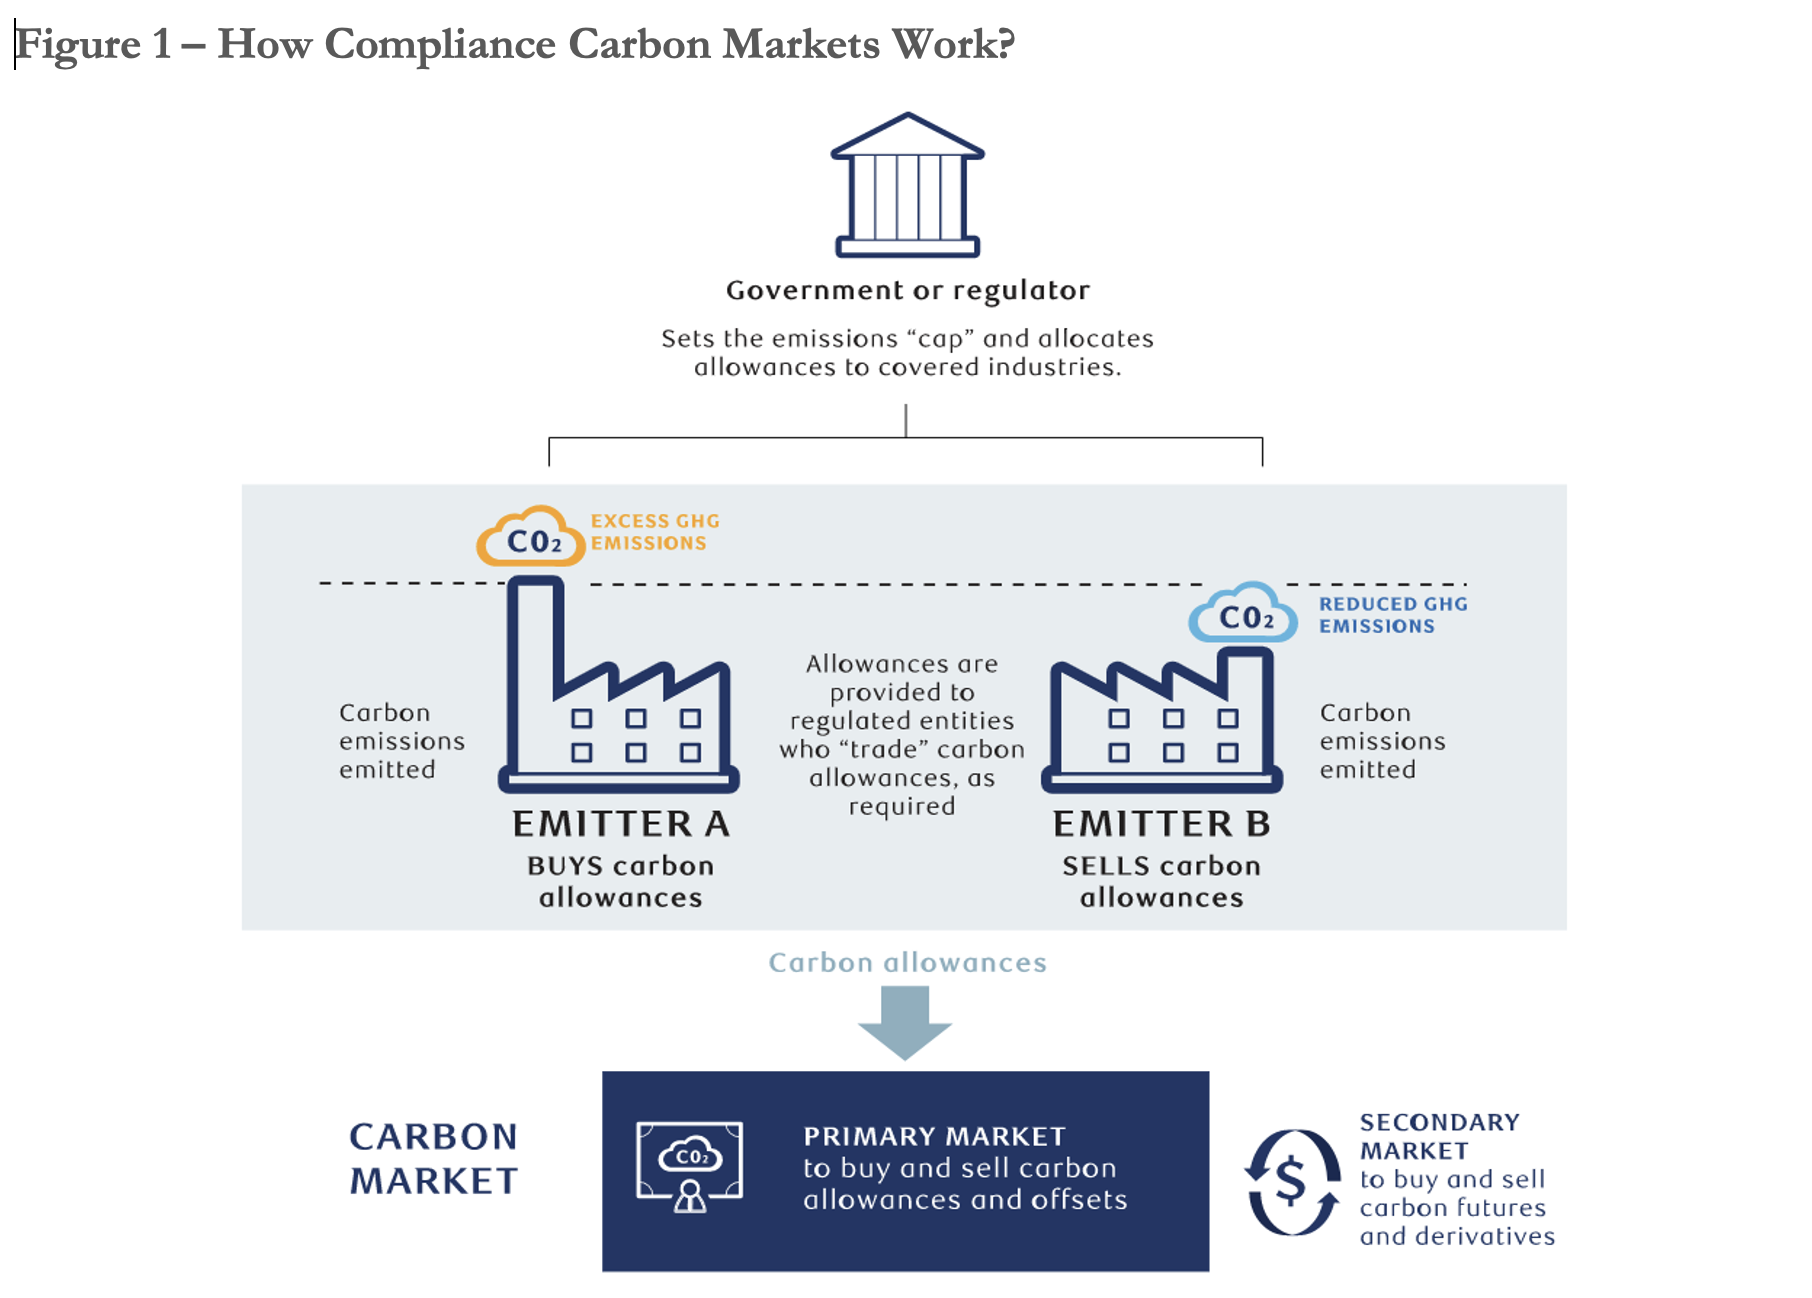
Source: Adapted from the Royal Bank of Canada.
Figure 1 above illustrates a typical case of a compliance carbon market. The regulator (e.g., the government) first sets an emissions cap for sectors or regions, then issues a certain amount of carbon allowances based on such cap, which it then sells to the regulated institutions (e.g., corporations). In a sense, a carbon allowance is a type of permission credit that institutions buy to be allowed to emit a single metric ton of CO2 (or CO2 equivalent for other GHGs). Companies that exceed their allowances of emissions would then have to buy additional credits from those with a surplus of allowances, where they emit lower than expected. This buying and selling is done through the carbon market.
Established in 2005, the European Union Emissions Trading System (EU ETS) is considered the oldest cap-and-trade system, and the largest carbon market by trading volume. Other countries that run national or subnational regulated carbon markets include, among others, the U.S., Canada, the UK, China, South Korea, and New Zealand.
Voluntary Carbon Markets (VCT)
Unlike compliance markets, voluntary carbon markets are unregulated, hence, they enable any institution seeking to reduce its carbon footprint to produce a revenue stream through offsetting its emissions. While unregulated markets are less restricted, as shown in Figure 2, their structure is more complex.
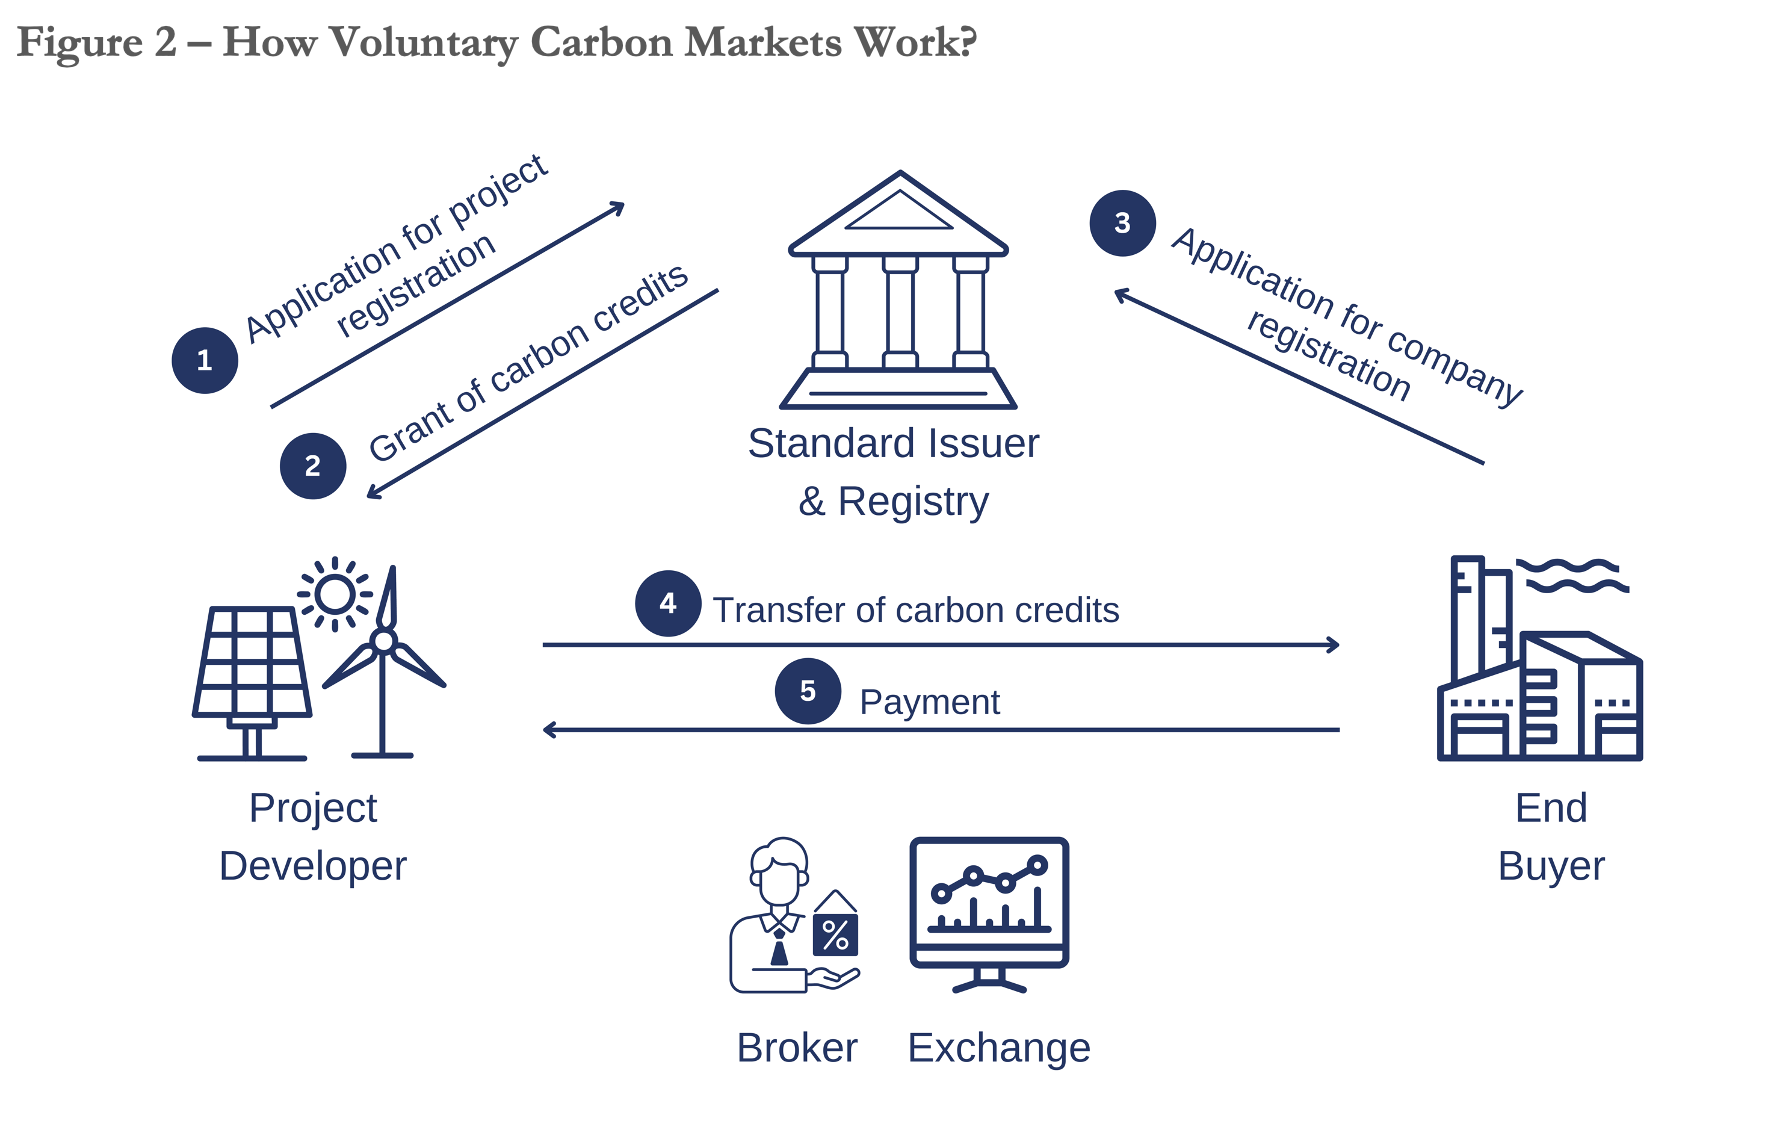
Sources: Adapted from EY Global and S&P Global.
Voluntary carbon markets involve four major players. First, the upstream part of the market involves project developers, who initiate the process by creating projects that result in the reduction, sequestration, or avoidance of carbon emissions. Those can include large- or small-scale developers, such as renewable energy companies, industrial plants that decarbonize their processes, farmers that adopt sustainable agricultural practices, or nature-based solutions (e.g., avoided deforestation).
Second, the downstream part of the market involves the end buyers, which are institutions that voluntarily commit to offset their GHG emissions. Those include corporations and organizations that set their net-zero targets and seek to achieve them. For example, Delta, Google, and Disney are amongst the largest buyers of carbon offsets, as they purchased around 7.8 million, 3.5 million, and 2.5 million metric tons of CO2 equivalent credits, respectively, between 2017 and 2019.
Third, at the core of voluntary carbon markets are carbon offset registries. Those are private third-party entities, responsible for certifying projects, issuing carbon offset credits, keeping track of tradable offsets, tracking their retirement, and ensuring that each credit is only purchased by a single entity. Since carbon-reduction projects are non-regulated voluntary initiatives, registries play a crucial role in ensuring the integrity of the market. Most importantly, projects need to be verified prior to credit issuance. In other words, a unique third party must certify that a selected project meets its claimed reduced emissions. Once certified, projects are issued tradable carbon credits, each representing a single metric ton of reduced CO2 equivalent of emissions. Institutions that want to offset their emissions through buying carbon credits must also hold accounts in such registries. Among the most notable carbon registries is Verra, a non-governmental organization that develops and manages standards to catalyze climate action and sustainable development.
Fourth, an important component of the voluntary market, which links the supply and demand of carbon offsets/credits, includes retail traders, exchanges, and brokers. Exchanges or retail traders buy large amounts of credits from suppliers, bundle them into portfolios, and sell them to end buyers with a commission. Brokers, on the other hand, usually buy credits from a retail trader and resell them to the end buyers, for an extra transaction cost.
Despite their more complicated structure and smaller size, voluntary carbon markets can offer several benefits relative to compliance markets. Those involve lower development and transaction costs, in addition to greater flexibility for participation across a wider range of locations and sectors. On the other hand, given their unregulated nature, lack of governance, and the risk of low-integrity and low-quality markets and credits, might be an issue.
The Growth and Evolution of Global Carbon Markets
As shown in Figure 3, the total turnover of key global carbon markets grew by more than 20-fold over the last 6 years, from a mere value of $33 billion in 2016 to over $750 billion in 2021 (converted from Euros using the current exchange rate). Carbon markets especially witnessed an impressive growth of 164% in 2021. The value of most major carbon markets significantly increased in 2021, with the EU ETS growing at 162%, the North American system at 89%, and the Chinese market at 402%. While global market growth was driven by a 24% increase in traded emissions, which reached 16 million metric tons in 2021, the growth in turnover was mostly driven by a steep rise in prices.
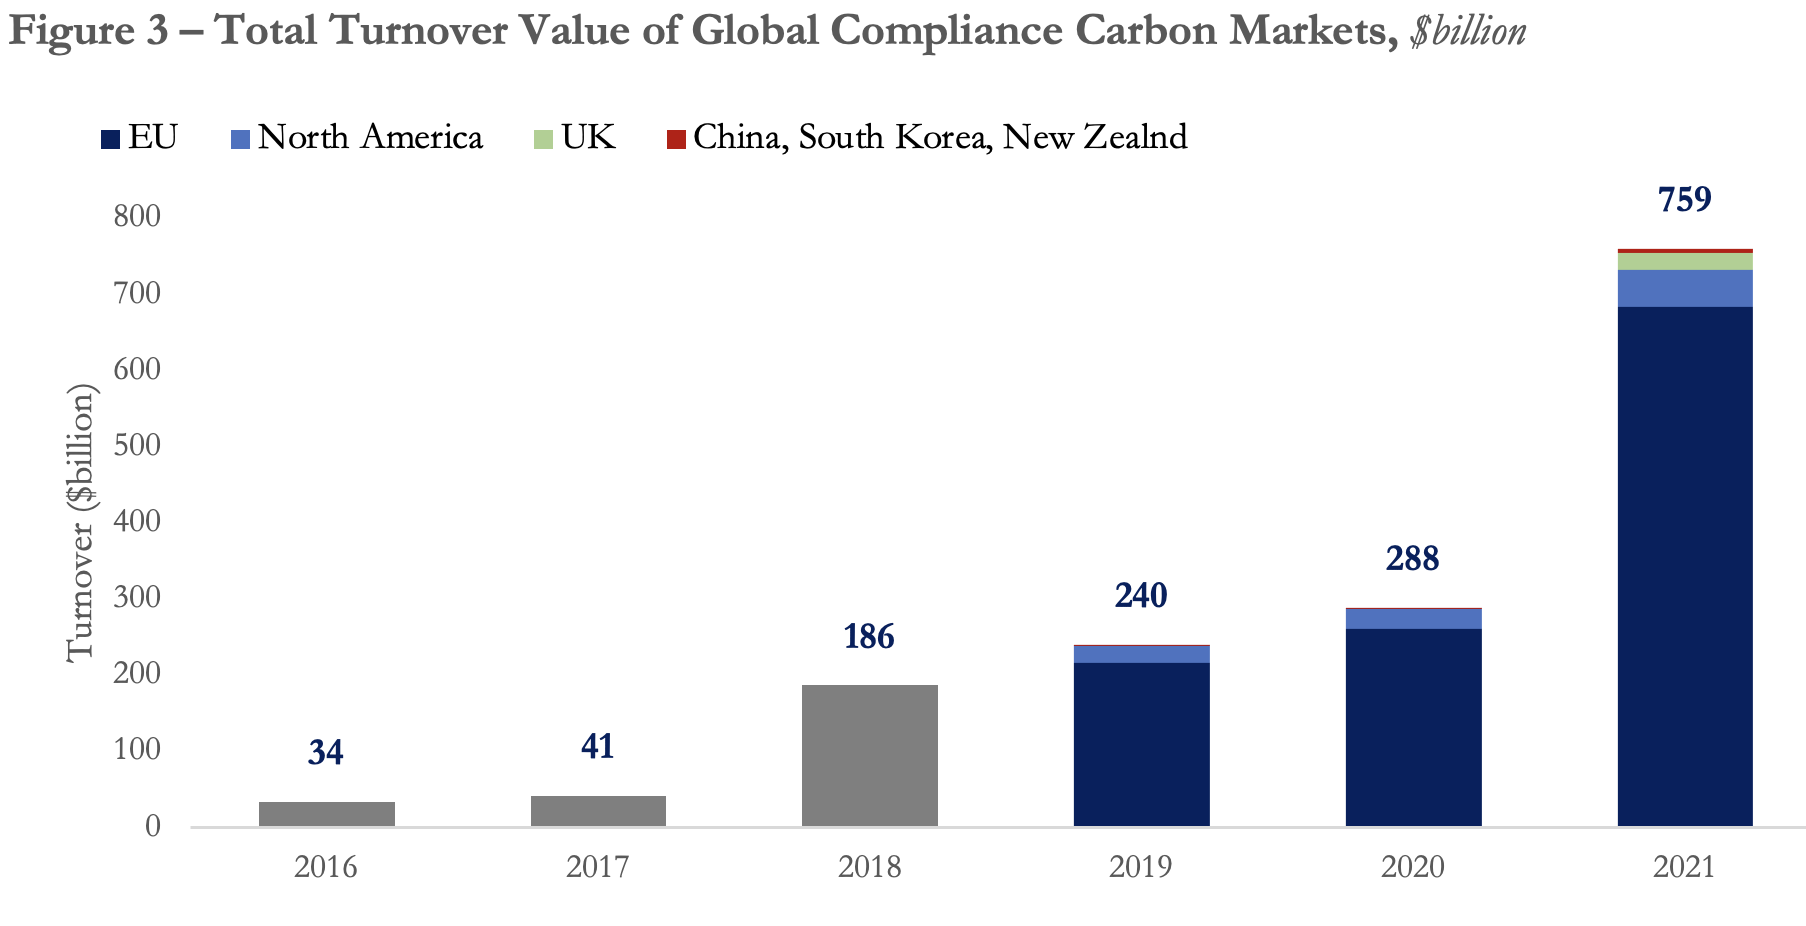
Source: Refinitiv Carbon Markets Year in Review 2022.
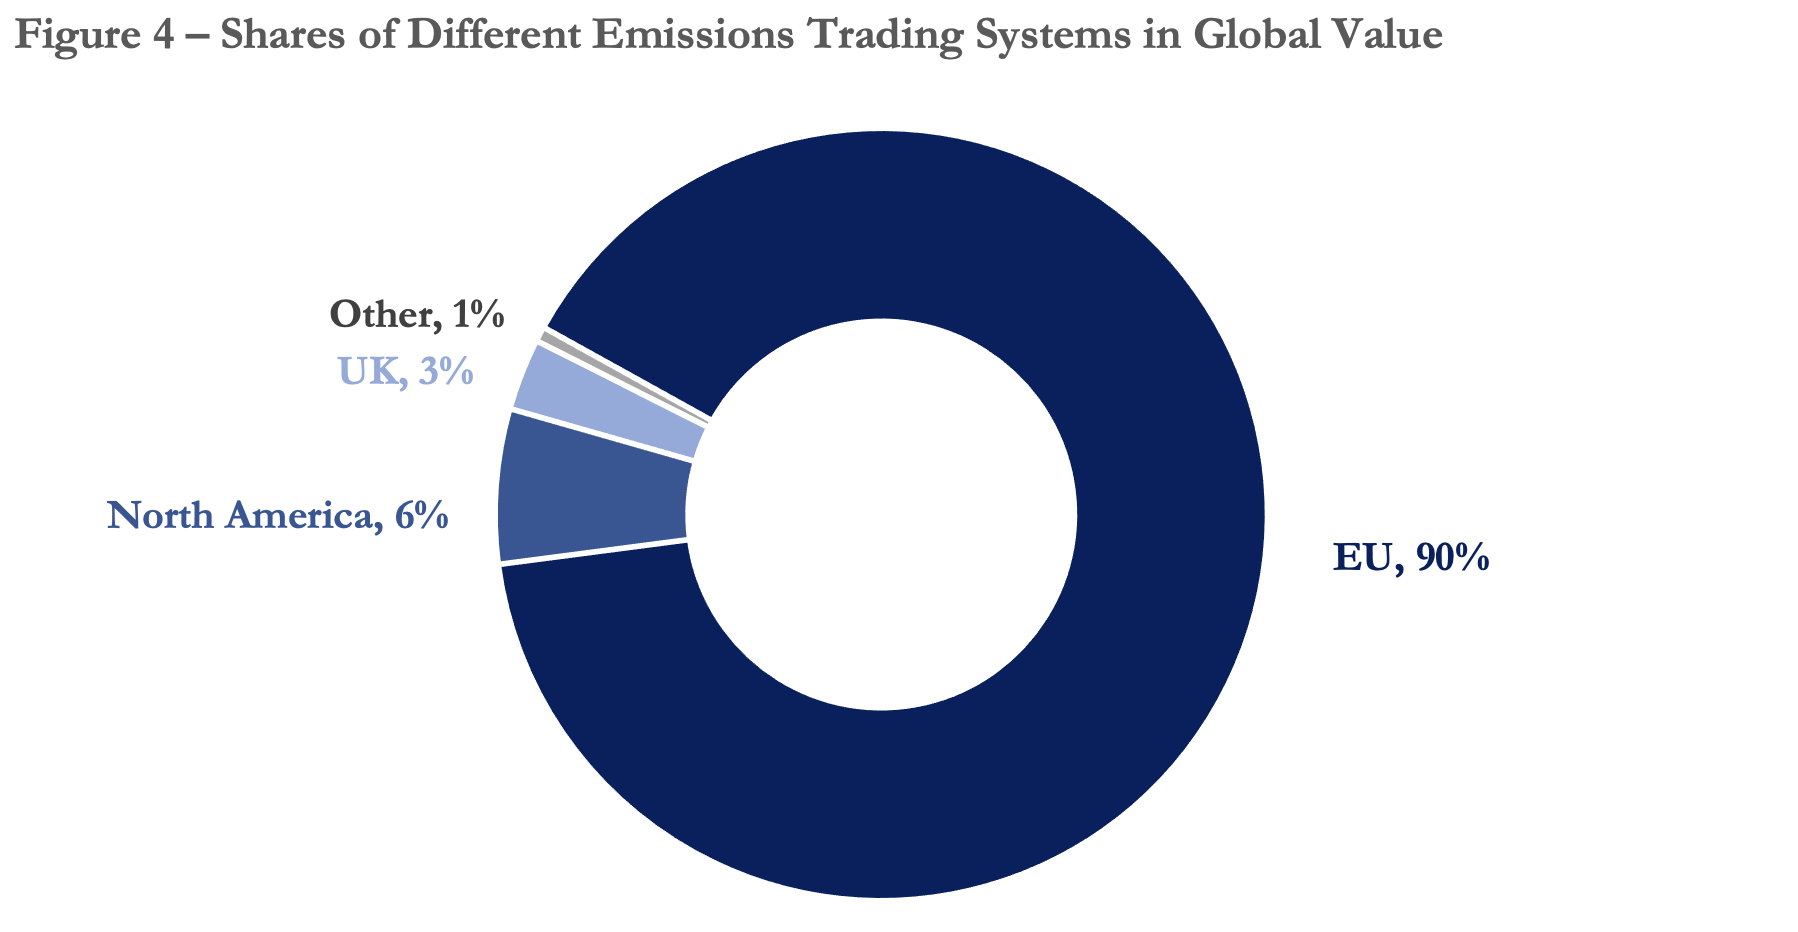
Figure 4 shows the 2021 shares of different carbon markets in global value. The EU ETS is the largest carbon market by traded value, accounting for 90% of global turnover. In 2021, the EU ETS registered a total turnover of $676 billion. The North American carbon market, constituting the Western Climate Change Initiative (WCI) and the Regional Greenhouse Gas Initiative (RGGI) in the U.S. and Canada, came next with a total value of $49 billion or 6% of global markets. The UK ETS, which began trading in 2021 after its separation from the EU ETS, accounted for 3% of global value, equivalent to $23 billion. Other markets, including China, South Korea, and New Zealand, accounted together for the remaining 1%.
Source: Refinitiv Carbon Markets Year in Review 2022.
Most major cap-and-trade trading systems witnessed a rapid increase in the prices of carbon allowances in 2021. Figure 5 presents the evolution of carbon allowance prices in major markets, during the second half of 2021. Prices in the EU ETS grew by almost 50% over the six months. In the UK and South Korea, carbon credit prices almost surged by 70% during the second half of the year. In North American markets, prices rose by almost 40-50% between July and December, and by almost 70% over the course of the year.
Figure 5 – The Evolution of Carbon Allowance Prices in the Second Half of 2021, Index
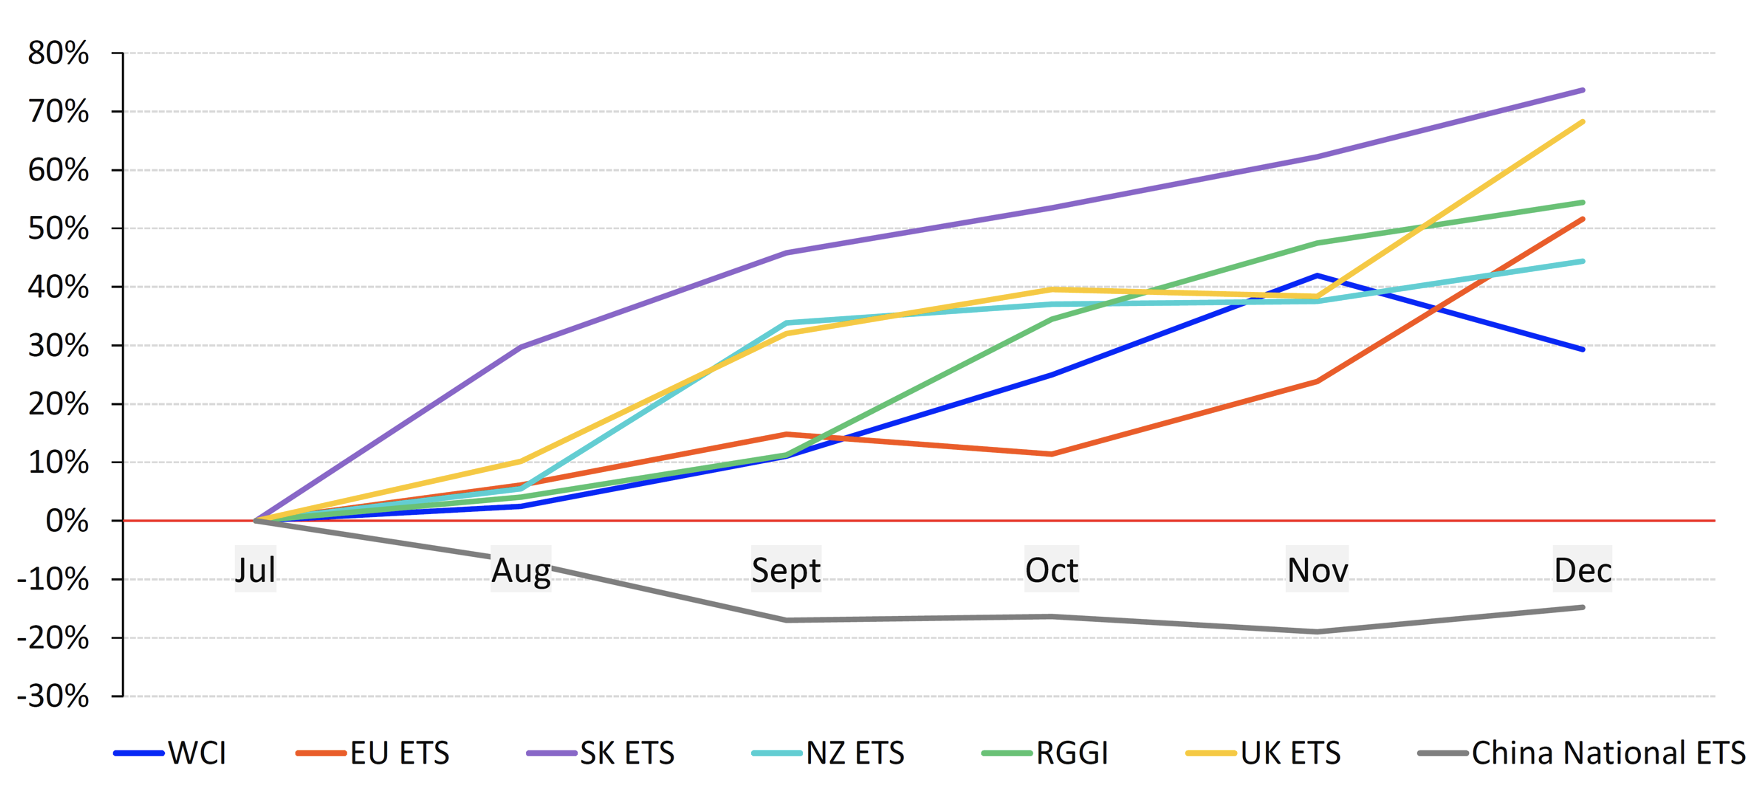
Source: Refinitiv Carbon Markets Year in Review 2022.
Unlike compliance carbon markets, voluntary markets are still small. In 2021, the total turnover stood at $1 billion, only 1% of the total turnover of both carbon markets together. Despite their small size, voluntary carbon markets are growing at an impressive rate. Traded volumes reached an all-time high of 300 million metric tons between January and November 2021, almost 1.6 times the 188 million traded volume in 2020 and three-fold the volume in 2019. The weighted-average price of carbon offsets also increased to reach $3.5 per metric ton in 2021, up from $2.5 in 2020. Figure 6 below shows the monthly traded volume of carbon c between 2020 and 2021.
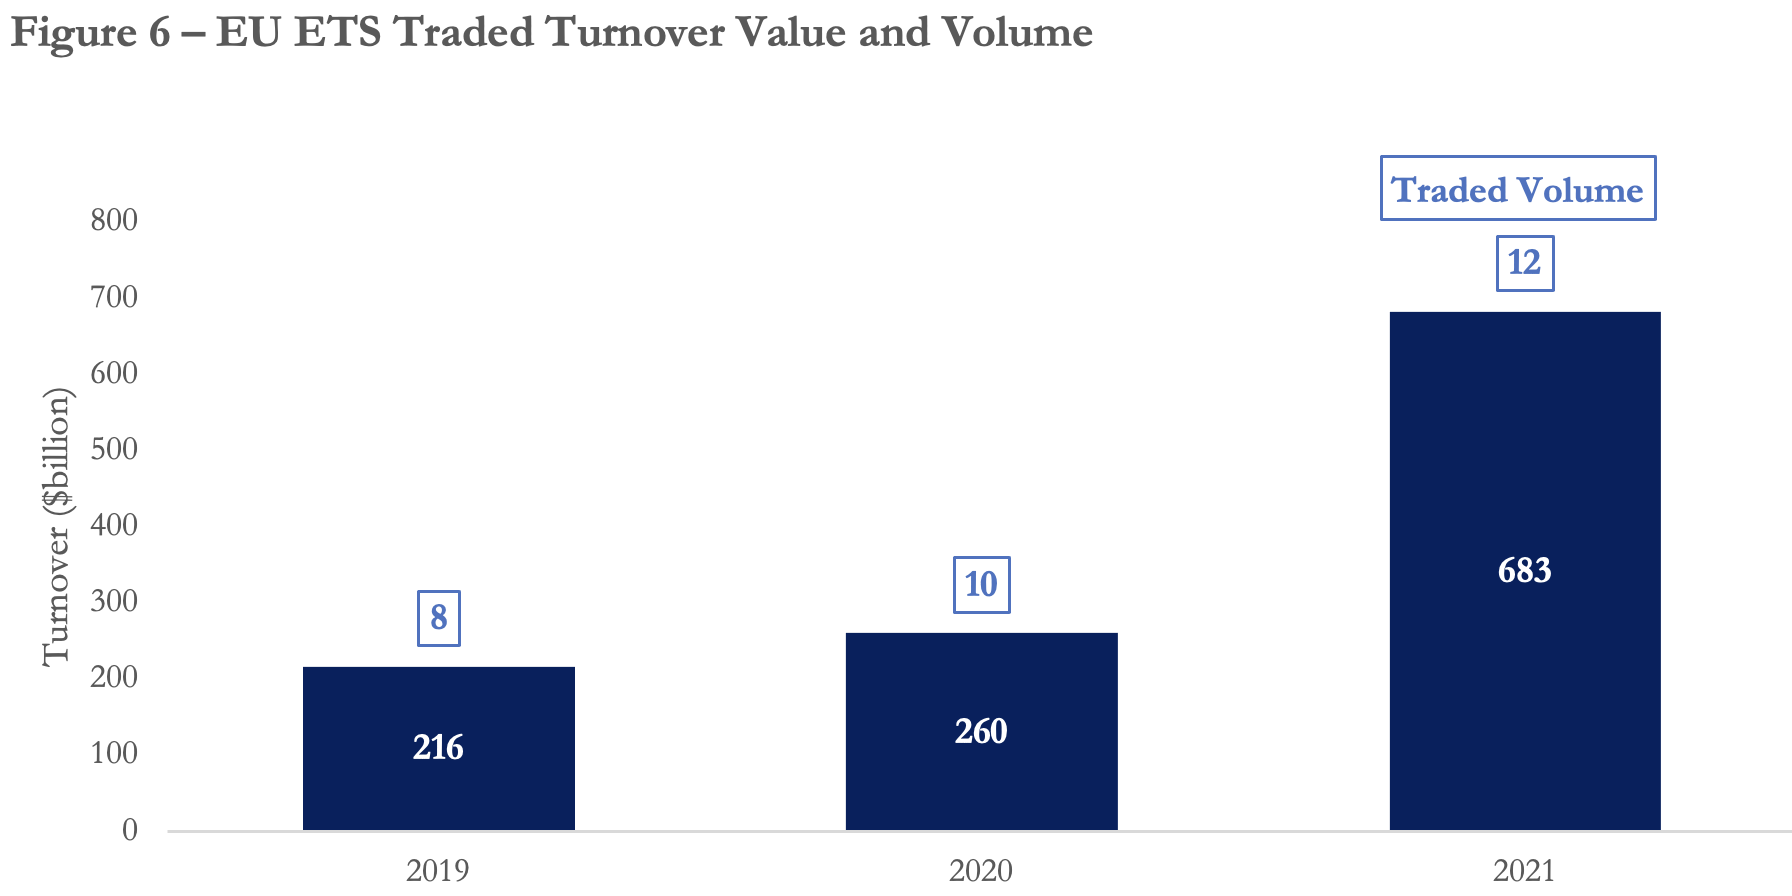
Source: Refinitiv Carbon Markets Year in Review 2022
The EU and UK Emissions Trading Systems
The European ETS is the oldest and largest carbon market by traded volume and value. Established in 2005, it is a cornerstone of the EU policy for climate action and scaling up finance for mitigation. The trading system covers CO2 emissions, as well as other GHG emissions, including nitrous oxide and perfluorocarbons. Participation in the EU carbon market is compulsory for corporations in several sectors, including electricity and heat generation, energy-intensive industries (e.g., metals, cement, chemicals, etc.), and aircraft operators.
The total turnover value in the EU ETS reached a record high of $676 billion in 2021, jumping by around 216% from 2019 and 162% from 2020. Between 2020 and 2021, the total traded volume of emissions increased by 17%, to reach 23 billion metric tons of CO2 equivalent, the largest of all carbon markets.
Increasing credit prices, however, were the main factor behind the large market expansion. While at the start of 2021 allowances traded at a price of 33 Euros per metric ton, they more than doubled during the year, to reach around 90 Euros in early December, before slightly dropping to around 80 Euros by the end of the year. Over 2021, carbon credit prices averaged at around 54 Euros per metric ton, compared to 25 Euros in 2020. Figure 7 below shows this evolution in carbon allowance prices in the EU ETS.
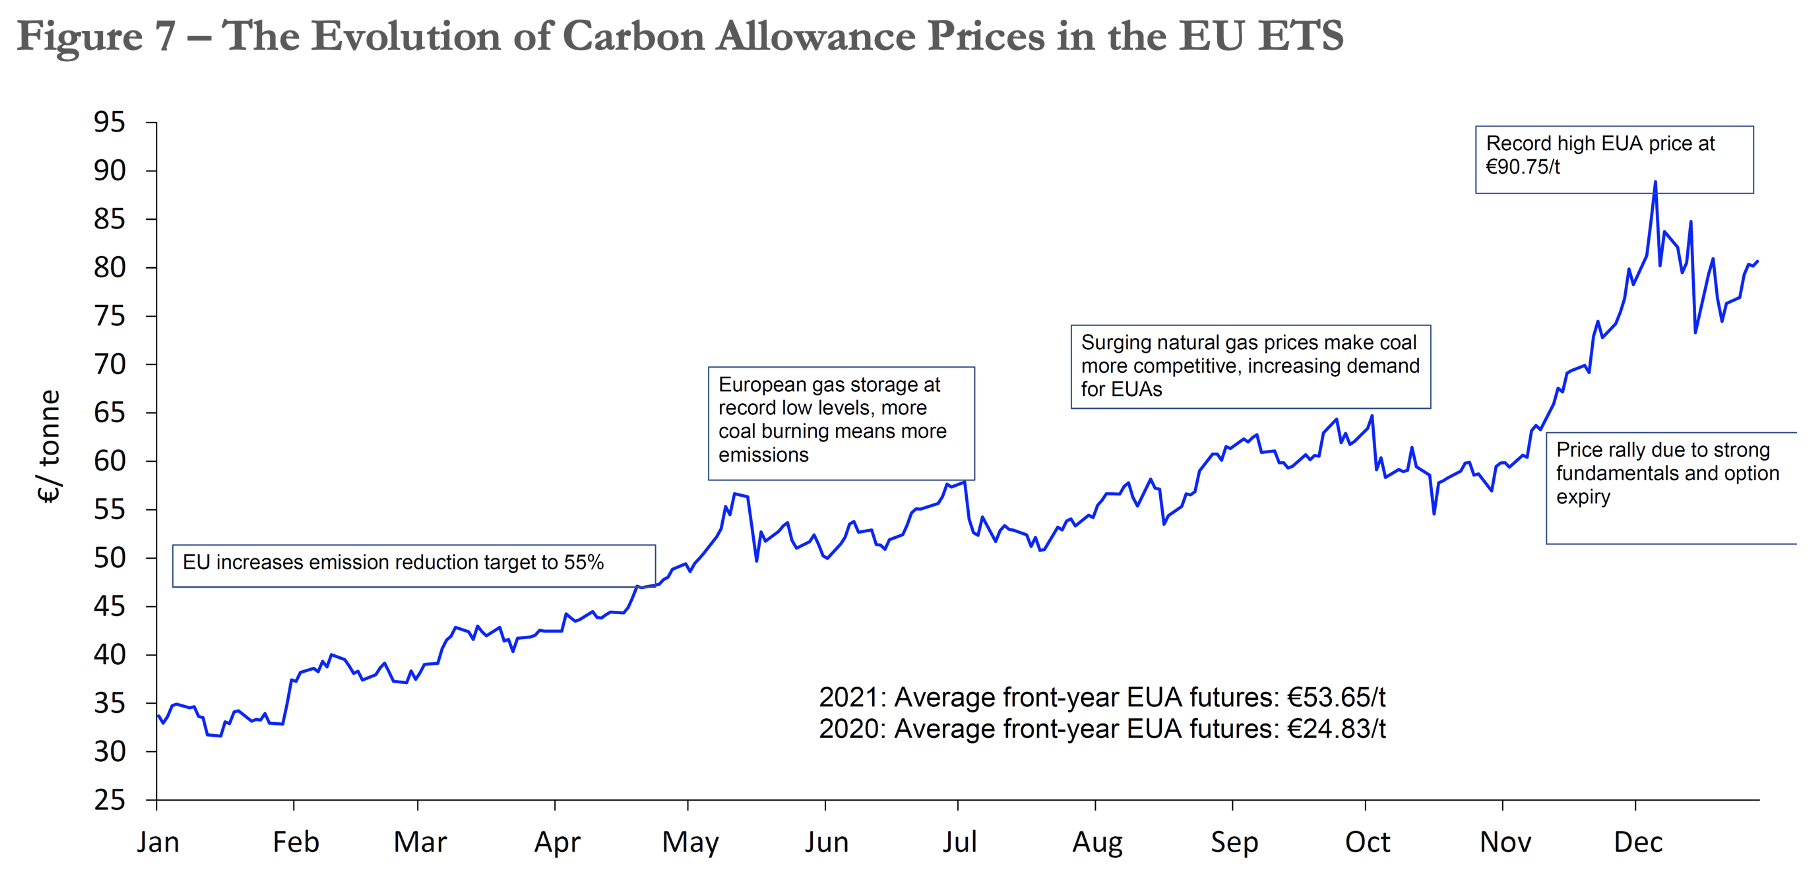
Source: Refinitiv Carbon Markets Year in Review 2022.
Higher prices were mostly driven by two factors. First, with the EU’s pledge to cut emissions by 55% by 2030, market participants expected a tighter market. As more organizations commit to net-zero, the demand for carbon offsets will increase, driving prices up. Second, with the global natural gas shortage and soaring prices, more EU power producers have shifted to coal as a cheaper alternative.
Since coal emits more GHGs than natural gas, the demand for carbon offsets from power producers has increased to compensate for regressing on their net-zero commitments.
Prior to Brexit, UK institutions were part of the EU ETS. Following its exit from the EU, the UK launched its separate emissions trading system in January 2021, transferring almost 2000 entities to the new trading system. The UK ETS closely mirrors that of the European bloc, covering similar sectors and gasses. In 2021, the total turnover value stood at almost $23 billion, with 335 million tons of traded emissions. While starting from the European benchmark, credit allowances in the UK system
The North American Carbon Markets
Some of the most active carbon markets exist in North America, particularly the U.S. and Canada. While carbon markets in the U.S. are not regulated at the federal level, several states have taken the initiative by setting their own trading systems. In this article, we focus on the two main carbon markets in North America, the Regional Greenhouse Gas Initiative (RGGI) and the Western Climate Initiative (WCI).
Established in December 2005, the RGGI is the oldest compliance carbon market in the U.S., which covers twelve states in the Northeast and Mid-Atlantic region. At inception, the market included the seven states of Connecticut, Delaware, Maine, New Hampshire, New Jersey, New York, and Vermont. In 2007, the additional three states of Maryland, Massachusetts, and Rhode Island joined the RGGI, followed by Virginia in 2021 and Pennsylvania in early 2022. Under the RGGI, power plants with a capacity of at least 25 megawatts are mandated by state law to obtain carbon allowances for each metric ton of CO2 emitted.
The WCI was established in 2007, grouping the five U.S. states of Arizona, California, New Mexico, Oregon, and Washington. The initiative was launched to build on individual-state and regional carbon trading, bringing together the West Coast Global Warming Initiative (California, Oregon, and Washington) and the Southwest Climate Change Initiative (Arizona and New Mexico) that existed at the time. In 2007 and 2008, two more U.S. states, Montana and Utah, joined the WCI, in addition to the four Canadian provinces of British Columbia, Manitoba, Ontario, and Quebec. Since then, several U.S. states and Canadian provinces have left or joined the WCI, to a current group of California and Washington from the U.S., in addition to Nova Scotia and Quebec from Canada. The WCI is the largest of the two North American carbon markets, covering almost all emitting sectors in the jurisdiction.
Together, the WCI and RGGI had a turnover value of $49 billion in 2021, trading around 2.7 billion metric tons of emissions. Those represented a value growth of 89% and a volume growth of 33%, compared to the previous year (Figure 8). Both markets also witnessed an increase in their allowance prices by almost 70% in 2021, compared to 2020.
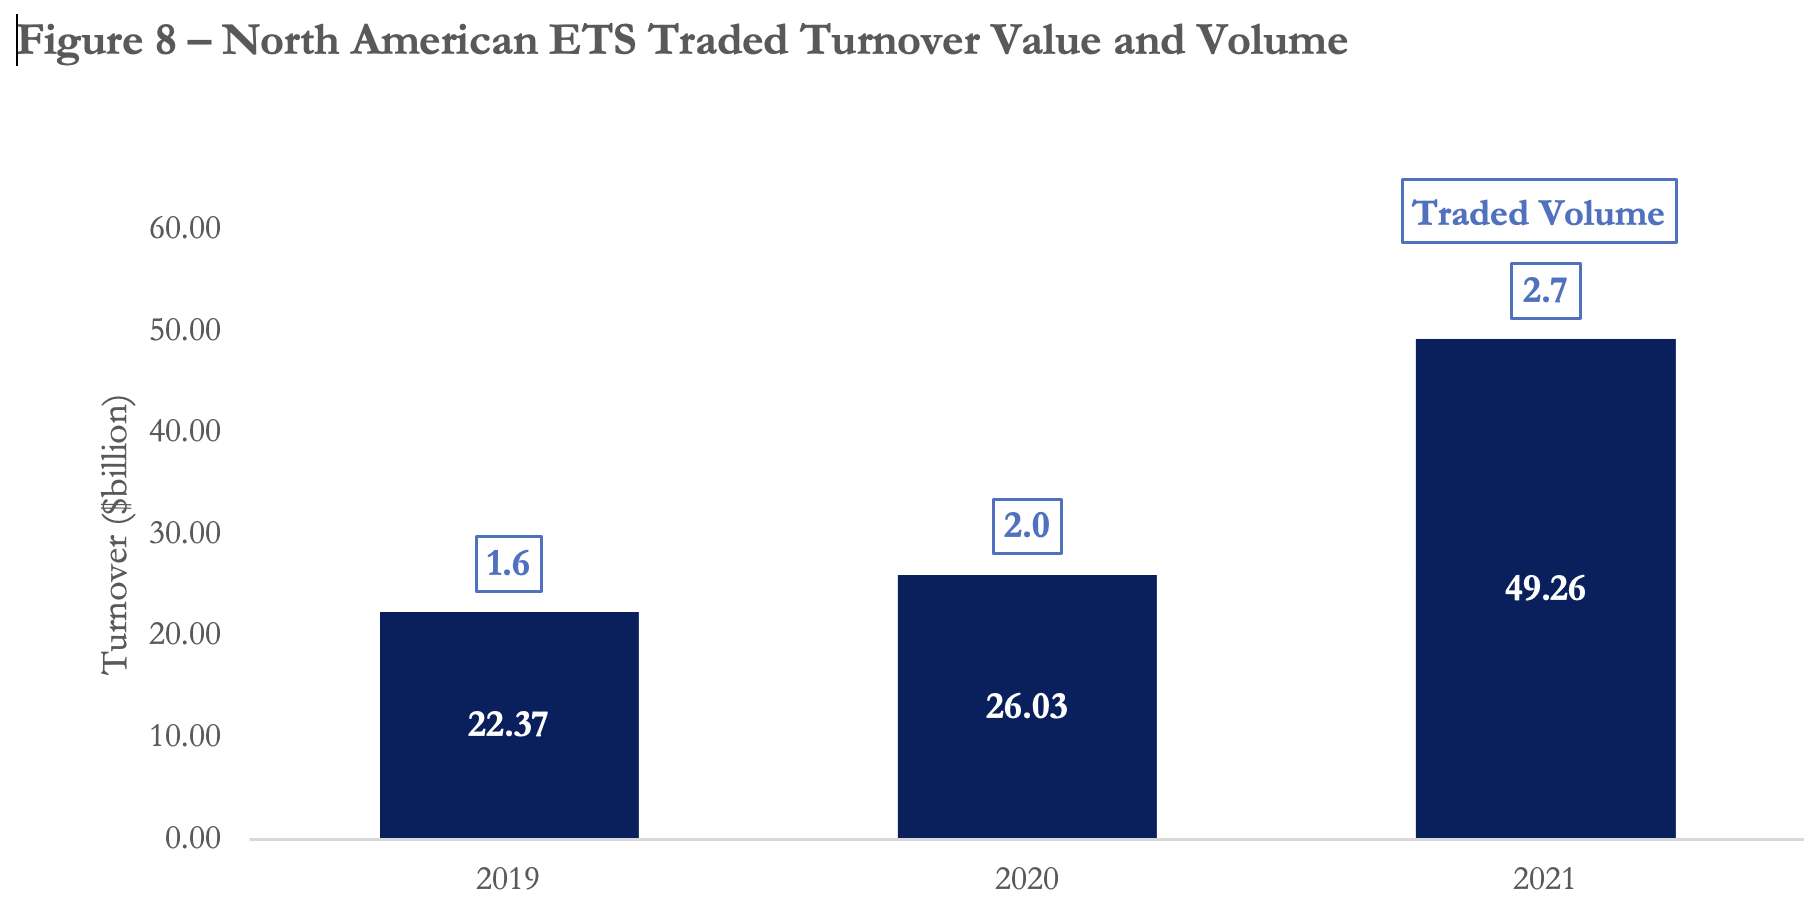
Source: Refinitiv Carbon Markets Year in Review 2022.
China’s New Emissions Trading System
China’s national ETS officially started trading in July 2021, to become the World’s largest carbon market in terms of covered emissions. Under such a mandatory system, power generators are obliged to participate, to obtain allowances for their emissions. Given the sector’s large role in the Chinese economy, the carbon market covers annual emissions of almost 4.5 billion metric tons of CO2, accounting for close to 40% of the country’s emissions.
Despite the large volume of emissions covered, the Chinese carbon market is still less liquid than its European and North American counterparts. In 2021, the volume of traded emissions stood at only 412 million metric tons, almost 3% and 15% of the traded volumes in the EU and North American ETS, respectively. The total turnover value of the Chinese market also stood at $1.3 billion, a fraction of the other major carbon markets. While the volume of traded emissions was at par with the UK ETS, which also started trading in 2021, the traded value was only 5.6% of that in the UK. This was due to the much lower price of carbon allowances in China compared to the UK. At the end of 2021, carbon allowances in China traded at around 7.5 Euros per metric ton of CO2, compared to over 90 Euros in the UK.
China’s ETS traded volume and price fall at the lower end of the scale. Unlike the UK ETS, which emerged from the well-established EU system, China’s ETS is still in its infancy. It is expected that as the market mechanisms develop and get upgraded, and the system includes several other sectors, such as cement and aluminum, the market will expand further and become more liquid.
One major difference between the Chinese ETS and other major cap-and-trade carbon markets is that the former is based on the intensity rather than the absolute volume of emissions. In the EU, for example, the emissions cap is set upfront, and participating institutions are then held accountable for the absolute volumes of emissions they produce. Given that, under the Paris Agreement, China pledged to cut its carbon intensity per unit of gross domestic product (GDP) by 60% to 65% by 2030, its trading system is set to oblige power plants to account for their emissions intensity, per unit of electricity generated, through obtaining carbon allowances.
The Role of Voluntary Agricultural and Forestry Offsets in the U.S.
Despite their much smaller size compared to compliance carbon markets, voluntary markets can offer multiple benefits when it comes to mitigating GHG emissions. While it is usually the case that highly structured and regulated compliance markets focus on energy generation and energy-intensive industries, voluntary carbon markets can provide more flexibility for other important sectors, such as agriculture, to price their emissions.
Agriculture and forestry activities can play a crucial role in mitigating climate change, as they are considered sources as well as sinks of emissions. While agriculture is a net emitter of GHGs, forests are net sequesters. On one hand, agricultural activities generate GHG emissions, such as CO2, methane, and nitrous oxide in the air, contributing to rising temperatures, while on the other, conscious agricultural and forestry practices can act as sinks, removing CO2 from the atmosphere, through carbon storage in soil and crops and the process of photosynthesis. In 2020, the agricultural sector contributed close to 18% of global GHG emissions, and 11% of U.S. emissions. Moreover, according to the U.S. Environmental Protection Agency, forestry and other land use removed almost 13% of U.S. GHG emissions.
Several agriculture and forestry carbon offset initiatives have developed in the U.S. in recent years. Such programs reward farmers and forest landowners, who implement climate-smart practices that contribute to the reduction or sequestration of GHG emissions. In general, there are five categories of agricultural and forestry management that can provide carbon offsets to reduce emissions
- Soil Carbon Sequestration projects: These involve adopting agricultural practices that can increase soil carbon storage, such as applying no-till or reduced-till methods, planting cover crops, and rotating crops.
- Reduced or Avoided GHG Emissions projects: These involve adopting agricultural methods that can reduce or avoid GHG emissions, such as the efficient use of fertilizers to reduce nitrogen use, better management of animal waste and composting, and improved water and residue management in cultivation.
- Afforestation and Reforestation projects: Afforestation is the development of tree cover to non-forested lands, while reforestation is the restoration of tree cover to previously deforested lands.
- Avoided Conversion projects: Those involve the prevention of deforestation of forestlands.
- Improved Forest Management projects: Those involve the implementation of land-management practices, which increase the average carbon per acre of forest (carbon stocking).
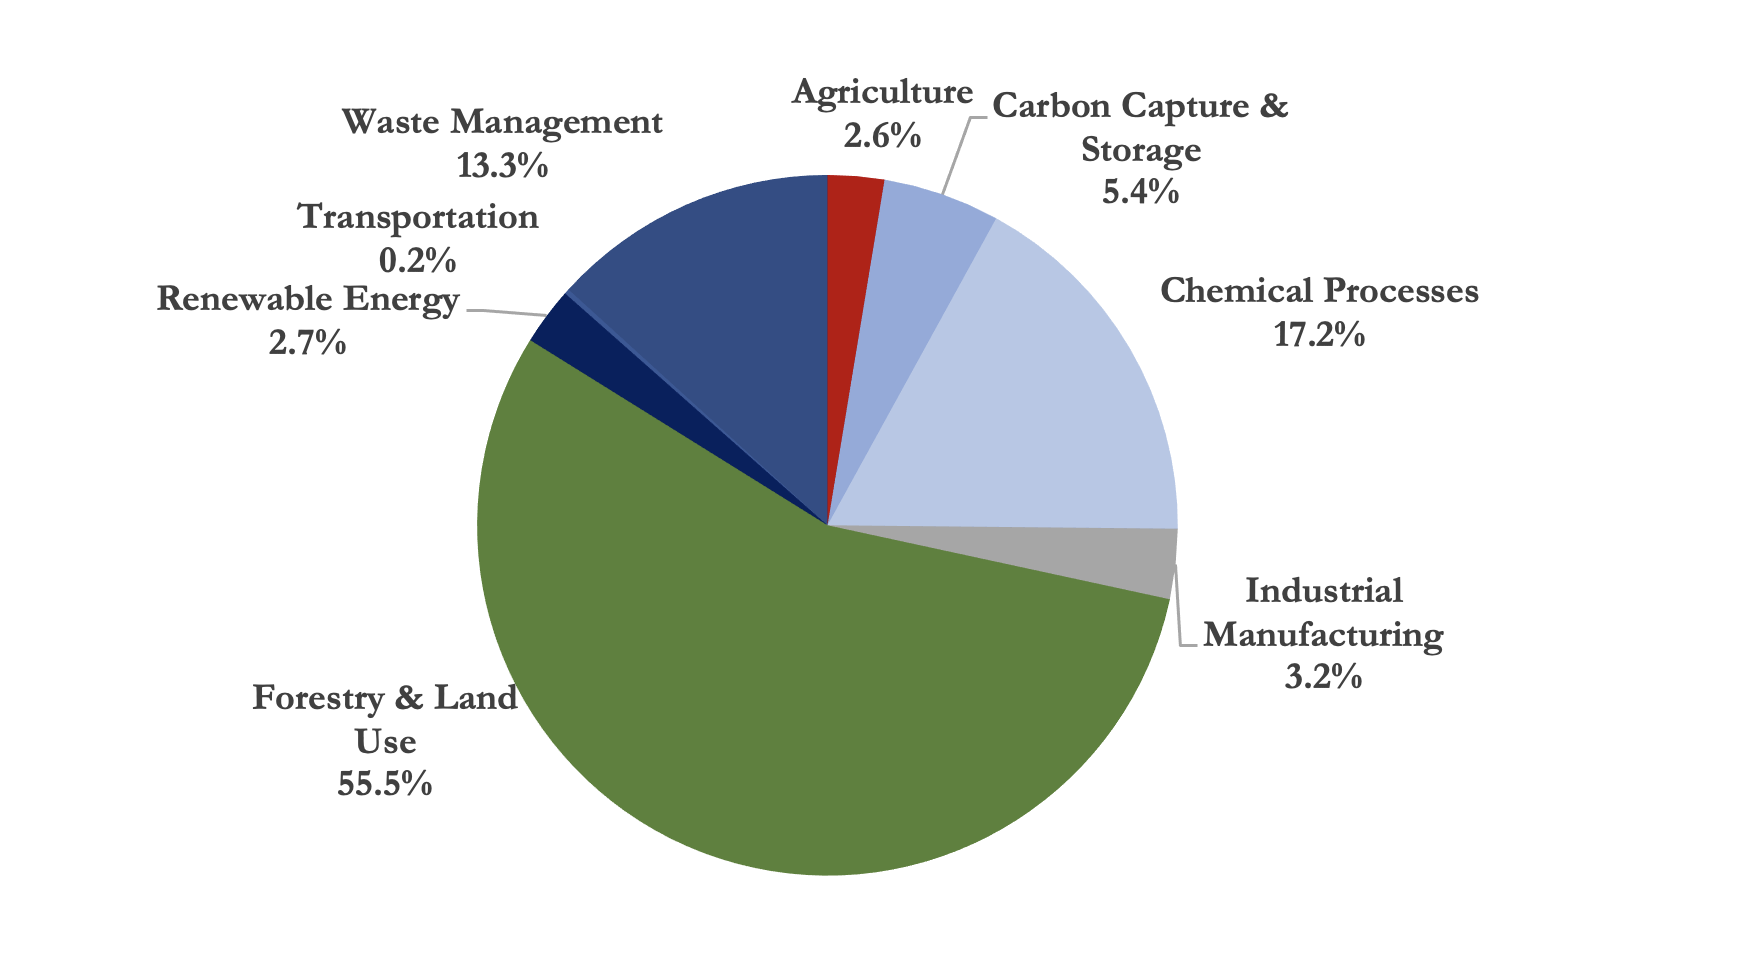
The graph below shows the percentage of carbon offsets issued in voluntary carbon markets, by different project activities in the U.S. While forest and land use activities issue the largest proportion of carbon offsets, accounting for 55.5% of the total, agriculture practices account for only 2.6%. It is estimated that global cropland can potentially sequester up to 570 million metric tons of carbon emissions per year. Enlisting climate-smart agricultural projects and issuing them the necessary offset credits can largely contribute to climate action.
The Outlook for Global Carbon Markets
As the urgency of climate change continues to increase, the role of carbon markets is only expected to grow. As many countries are updating their Nationally Determined Contributions and pledging to cut emissions within the next 2-3 decades, regulations are expected to tighten for polluting corporations. It is expected that the demand for carbon credits, both in compliance and voluntary carbon markets, will rise. As markets tighten prices are also expected to rise.
In the U.S., climate action is increasingly becoming more pronounced. The passing of the inflation reduction act, in particular, provides several tax credits for carbon removal activities in addition to decarbonization efforts, as we’ve discussed in a previous article. Such incentives are expected to push more project developers to seek rewards for their emissions reduction and offer more viable projects for carbon credits, increasing market activity.
It is uncertain how the global developments in energy prices will drive the development of carbon markets. If natural gas prices continue to rise and corporations increase their dependence on cheaper sources of energy, such as coal, demand for and prices of carbon credits will continue to rise. While this might seem positive for carbon market activity, it seems bleaker for the overall climate agenda.
Nonetheless, if held to high standards of integrity and transparency, carbon markets can help accelerate the necessary transformation by effectively putting a price on pollution and creating an economic incentive to reduce emissions. They can also help generate some of the huge sums needed to build resilience.
Moving forward, voluntary carbon markets will also play an increasing role in reducing emissions. Through involving the untapped sectors and activities in compliance markets, such as agriculture and forestry, participants can be incentivized to adopt smart solutions and practices with huge potential to reduce and sequester emissions. McKinsey & Co. estimates that the global demand for voluntary carbon credits could increase 15-fold by 2030 and 100-fold by 2050. For that to happen several challenges in such markets should be addressed, including setting clear, standardized, and verifiable criteria for ensuring the quality of credits, developing safeguard mechanisms to ensure market integrity, as well as developing and utilizing digital monitoring, reporting and verification systems to reduce costs and ensure efficiency.
Also, nations must address the problem of carbon leakage. This is where companies act to reduce their domestic production of carbon or GHG in products like high energy/carbon-intensive products like cement, steel, fertilizers and chemicals. At the same time, these same companies will off-shore these activities to countries without the same carbon regulations. Thus creating the “leak” to the carbon trading system in the domestic country.