The population dynamics of China have been a topic of concern ever since the disastrous advent of 1-child policy. The country’s size and aging population presents unique challenges for its economy and society. COVID-19 pandemic exacerbated these issues, bringing them to the forefront of discussions about the country’s future and its ability to grow. In this article, we will explore the current state of China’s population dynamics, including pre-pandemic trends and the impact of COVID-19. We will also look forward to 2050, examining the projected demographics and what this means for the Chinese economy.
Ultimately, we will address the pressing question of whether these challenges can be mitigated and what actions must be taken now to ensure a sustainable future for China. The time for Chinese leaderships to act is now and this article aims to provide insights and analysis to help guide decisions that will shape the country’s future. Sadly for China’s future, it’s extremely difficult to encourage potential parents to reproduce when events like the Shanghai shutdown and family financial pressures stemming from a weak social safety net negatively impact the economy. The Chinese government can’t simply declare this is a national policy, direct billions of yuan towards it and make children appear.
Population Trends and Demographics Prior to the Pandemic
Prior to the pandemic, China’s population was already aging rapidly due to the one-child policy implemented in 1979. The policy was meant to curb population growth, but it had unintended consequences. Limiting the number of children families could have led to a significant decline in the fertility rate. This, coupled with increased life expectancy, resulted in a rapidly aging population.
Furthermore, over the six decades before the pandemic, the total Chinese population increased over two-fold, reaching 1.4101 billion by the end of 2019, compared to 0.6621 billion in 1960 (Figure 1). While the growth rate remained positive over this period, the population started growing at a declining pace, as can be seen by the red bars in the graph below. Population growth averaged only 0.57% during 2000-2019, down from 1.28% and 2.21% during the periods of 1980-1999 and 1961-1979, respectively.
Figure 1 – Total Chinese Population, End 1960 – End 2019, Millions
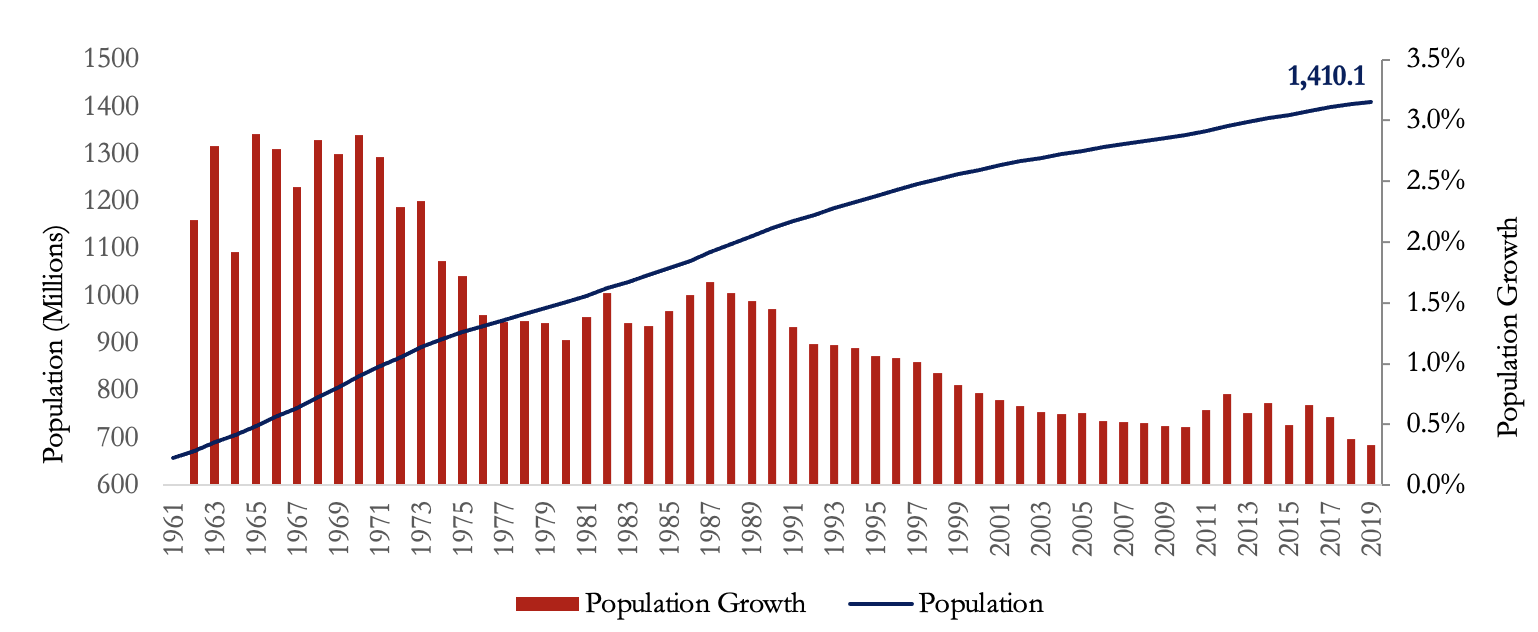
Source: National Bureau of Statistics of China.
Owing to its historically high population growth rate, China has the largest population in the World (Figure 2), accounting for 18.2% of the global population. India is the closest country to China (inhabiting 17.8% of the global population). The U.S. comes third, inhabiting a population that is only a quarter of that in China (4.3% of the global population).
Figure 2 – Top 15 Countries by Population Size, % World Population, January 2020

Source: United Nations 2022 World Population Prospects.
The slowdown of population growth in China has been fueled by sharply declining births (Figure 3), which fell by 47%, from an annual of 27.9 million births in 1960 to 14.7 million births in 2019. This has been paralleled by an increase in the number of deaths by 58% during the same period, from 6.3 million to 10.0 million deaths.
Figure 3 – Number of Birth and Deaths in China, 1970-2019, Millions
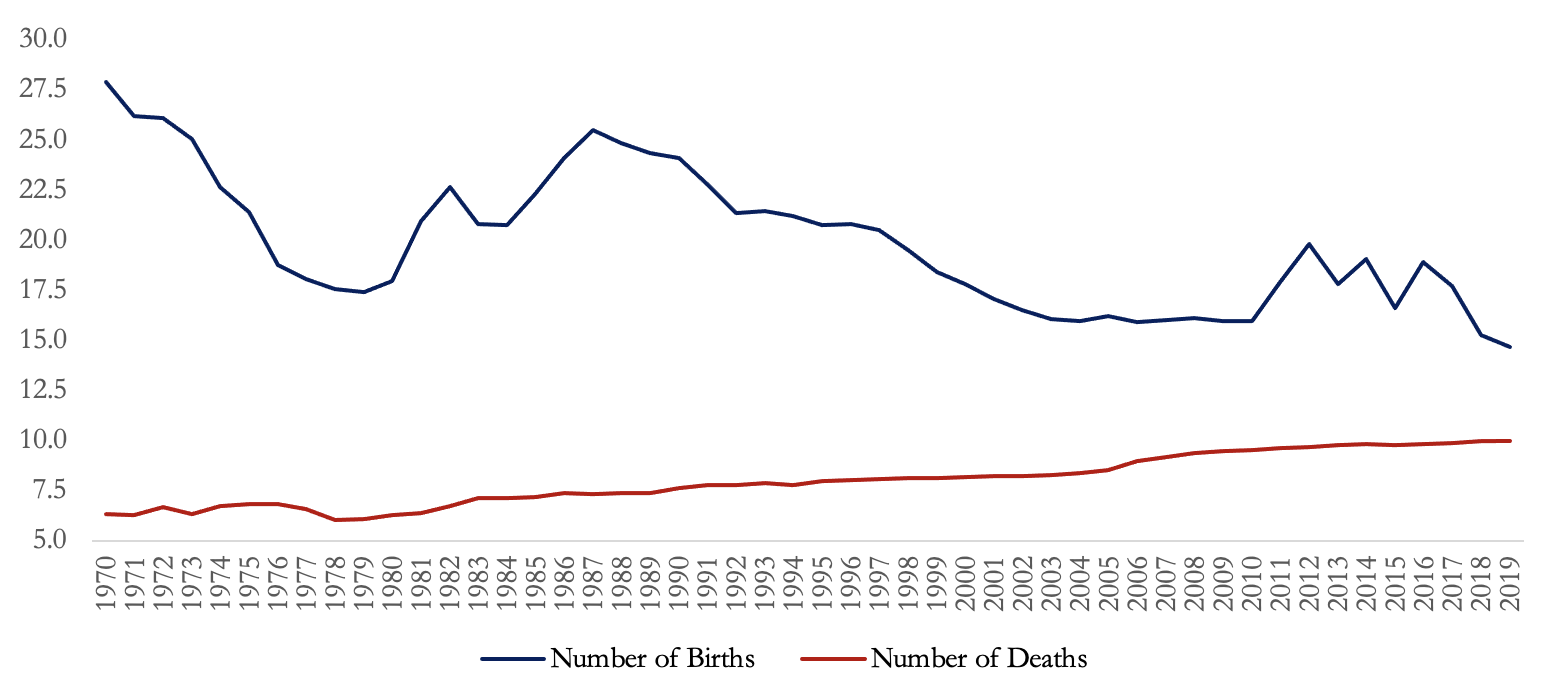
Source: National Bureau of Statistics of China.
Despite the falling number of births and increasing deaths, the natural population change, defined as the difference between the number of births and deaths in a given year, remained positive. The total number of births continued to surpass deaths, although with an increasingly narrowing gap. Moreover, the net migration rate in China has been very close to zero for decades. Accordingly, natural population change has been the sole force driving population growth. In 2019, there were a total of 10.4 births and 7.1 births per 1000 persons, resulting in a (natural) population change of around 3.3 per 1000 (Figure 4).
Figure 4 – Population Change by Component, 2000-2019, per 1000
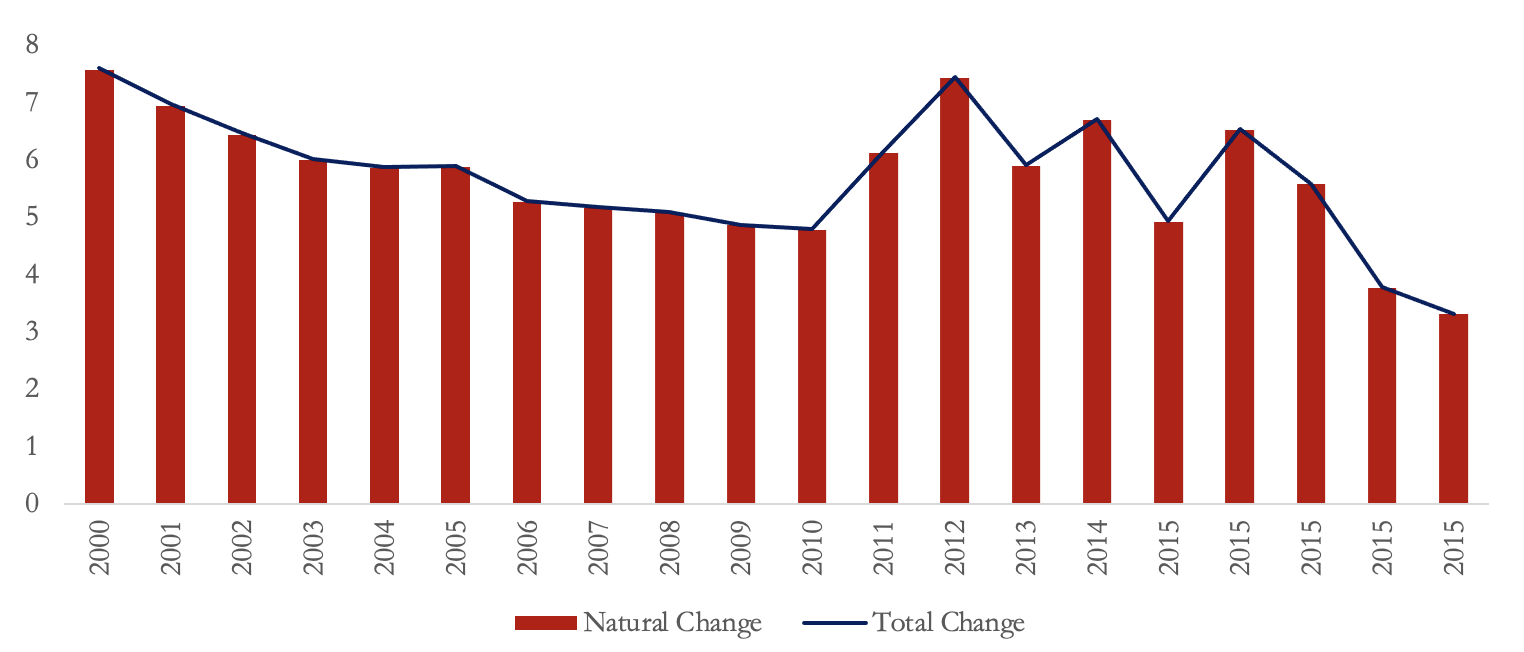
Source: National Bureau of Statistics of China.
Figures 5 and 6 below summarize the key Chinese population and age demographics in 2019. Countries and regions studied in previous articles of this series (European Union (EU) and Japan), as well as the World average, are added for reference. China had a very low fertility rate in 2019, at 1.5 births per woman, very close to that of the EU and Japan, and almost half the global average. China’s birth rate was also relatively low at 10.4 births per 1000, compared to a global average of 17.8 births. This is no surprise given the country’s one-child policy, which was strictly enforced by the government between 1980 and 2015 to slow population growth. China’s death rate relative to its population was very close to the global average, at 7.1 deaths per 1000. The declining Chinese birth rate has contributed to an increasingly aging population with respect to global standards. The share of those 65 and older was 12.6% in 2019, compared to a World figure of 9.2%. Moreover, the median age was almost 37 years in China, well above 29.5 years on average globally. The aging situation in China, however, is not as severe as in other high-income countries. Japan and the EU, for example, have much higher shares of elderly populations (above 20%) and median age (above 43 years). In fact, the 2019 Chinese share of the elderly population was still well below the 1980 shares in Japan and the EU. However, the aging situation has been getting worse relative to Chinese standards, as the share of those 65 and older and the median age were, respectively, close to 6% and 24 years in 1990, 7% and 30 years in 2000, while 9% and 34 years in 2010.
Figure 5 – Key Population Demographics in China, 2019
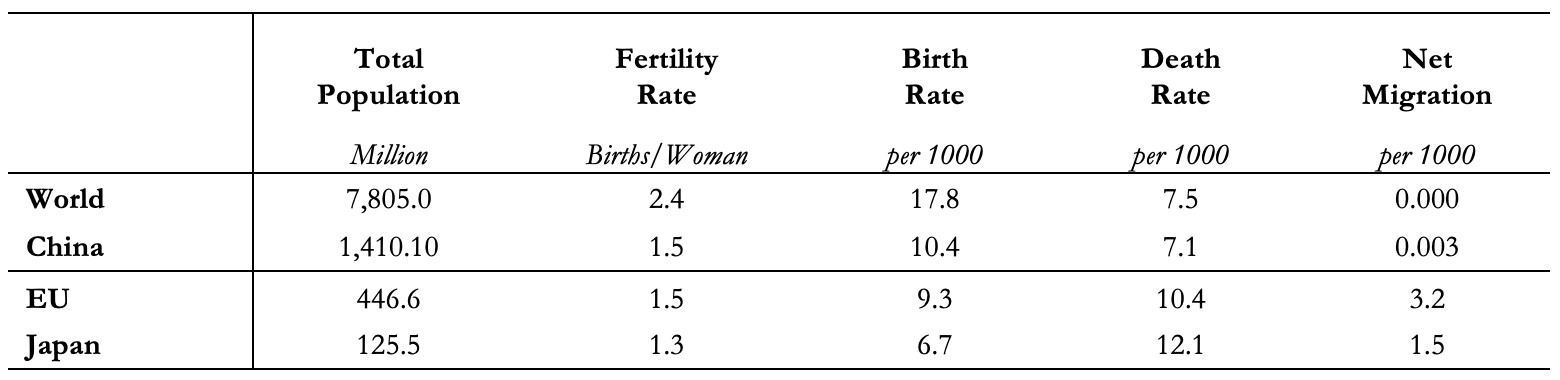
Note: Reported total population figures are at end-2019 for China and start-2020 for other regions. Source: National Bureau of Statistics of China and United Nations 2022 World Population Prospects.
Figure 6 – Key Population Age Demographics in China, 2019
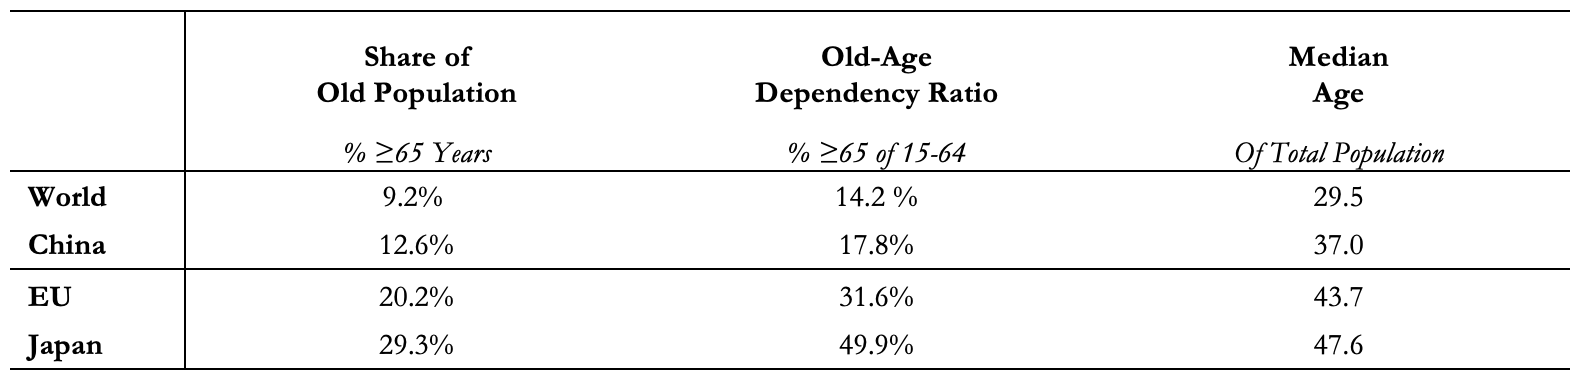
Source: National Bureau of Statistics of China and United Nations 2022 World Population Prospects.
Another feature of the aging population has been the rising old-age dependency ratio. The ratio (defined as the percentage of those 65 years and above to the working-age population between 15 and 64 years) has been rapidly increasing over the years, from 8.3% in 1990 to 17.8% by the end of 2019 (Figure 7). Despite the increase, this share was still almost half the EU average and a third of the Japanese ratio, despite being higher than the global average of 14.2%.
Figure 7 – A Rising Chinese Old-Age Dependency Ratio, %
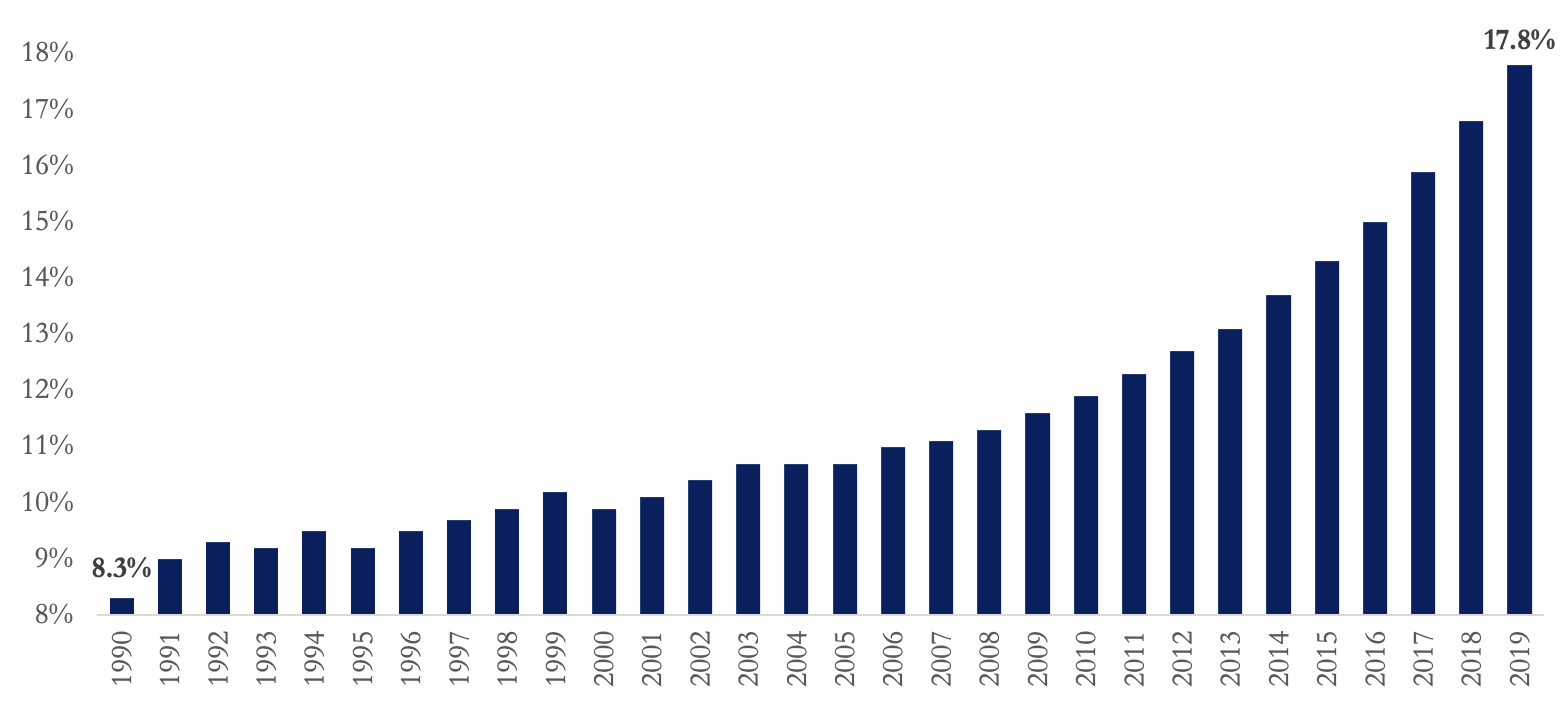
Source: National Bureau of Statistics of China.
Population Demographics During and After the Pandemic
The COVID-19 pandemic exacerbated China’s demographic challenges. The pandemic led to a decrease in the fertility rate as people delay having children due to economic uncertainty and health concerns. The National Bureau of Statistics reported that the number of births in China fell by 18% in 2020, the lowest level in nearly six decades.
At the same time, the pandemic also accelerated the aging of China’s population. The high mortality rate among older adults, combined with the decline in birth rates, has led to a significant increase in the proportion of elderly people.
As shown in Figure 8, while the Chinese population continued to rise during the first two years of the pandemic, 2020 and 2021, it did so at a much lower rate. The population growth rate in China was only 0.14% in 2020 and 0.03% in 2021, compared to an average of almost 0.5% in the four years prior to the pandemic. Following this trend, the Chinese population declined in 2022 for the first time in over 6 decades, dropping by -0.06%.
Figure 8 – Chinese Population During and After the Pandemic, End 2015 – End 2022, Millions
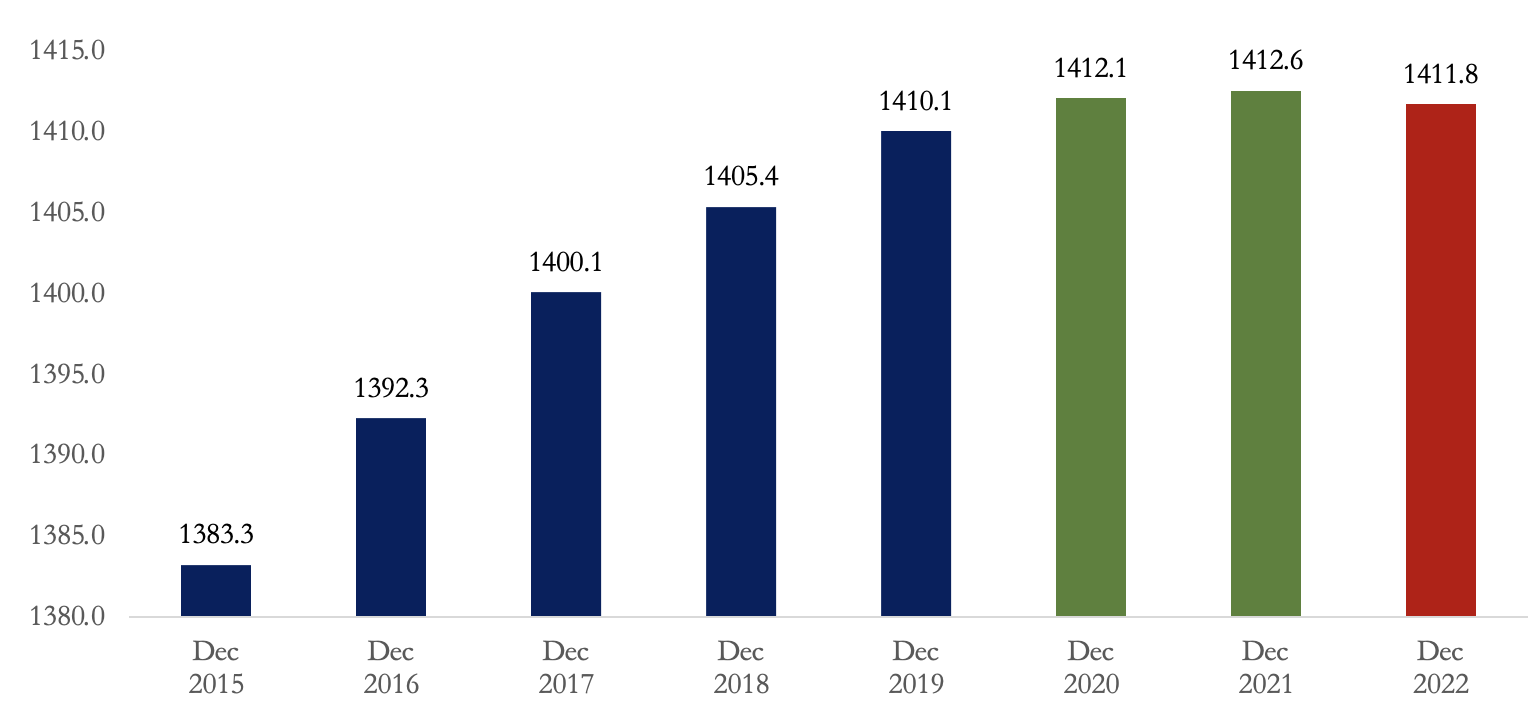
Source: National Bureau of Statistics of China.
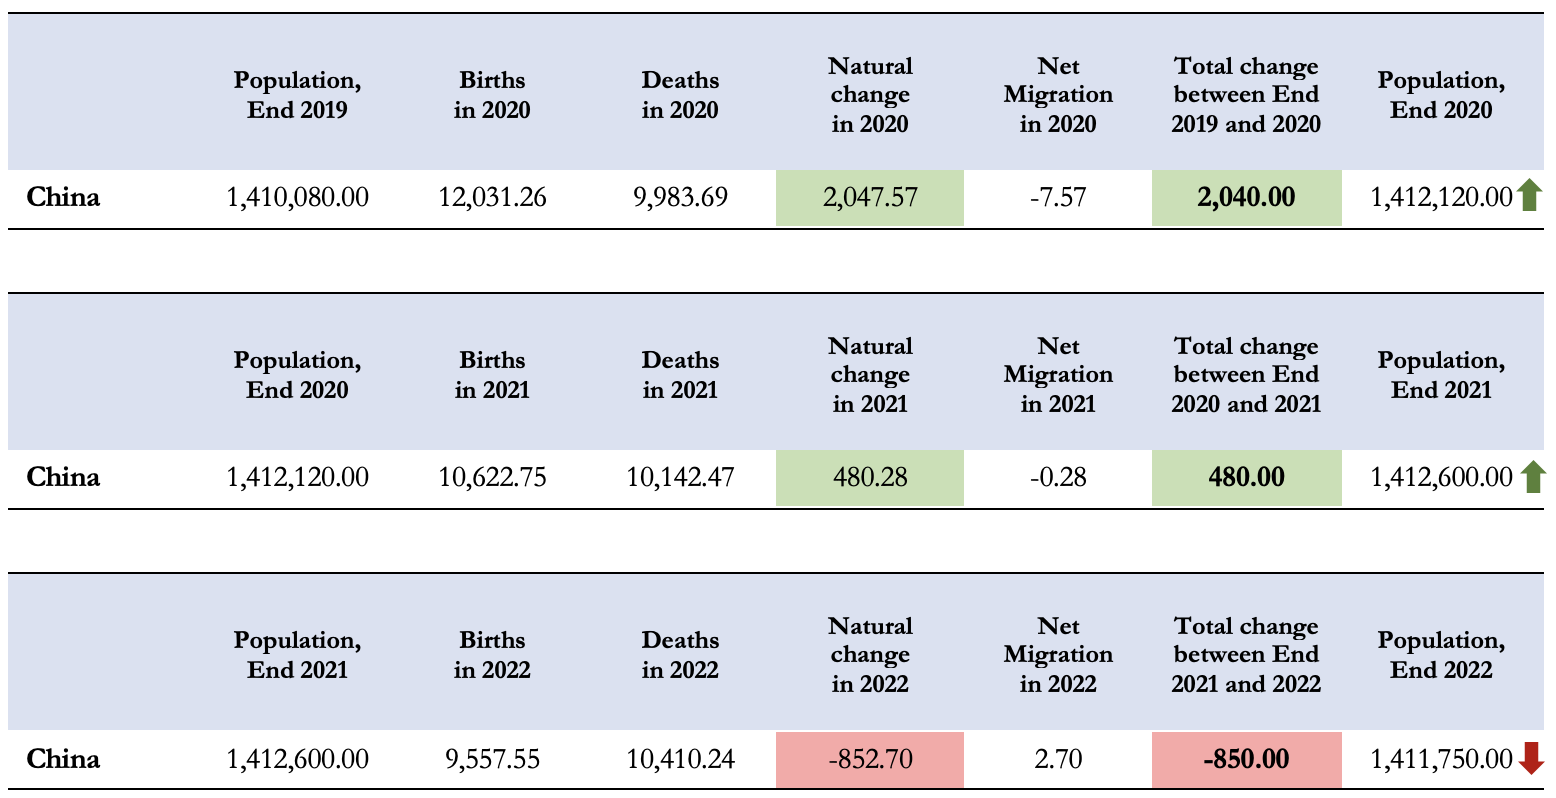
Figure 9 presents the components of population change during the pandemic. In 2020, there were a total of 9.98 million deaths in China and 12.03 million births. The number of births particularly declined by close to 2.6 million in 2020, as the pandemic and stringent lockdowns associated with the zero-COVID policy reduced marriages and the willingness to have children in such uncertain times.
Figure 9 – Population Changes by Component During the Pandemic, Thousands

Source: National Bureau of Statistics of China.
Figure 9 presents the components of population change during the pandemic. In 2020, there were a total of 9.98 million deaths in China and 12.03 million births. The number of births particularly declined by close to 2.6 million in 2020, as the pandemic and stringent lockdowns associated with the zero-COVID policy reduced marriages and the willingness to have children in such uncertain times.
Figure 9 – Population Changes by Component During the Pandemic, Thousands
Source: National Bureau of Statistics of China.
In fact, as shown in Figure 10 below, in 2020, China was among the 15 countries with the lowest fertility rate, as it dropped from 1.5 births per woman in 2019 to 1.3 in 2020.
Figure 11 – Bottom 15 Countries by Fertility Rate, 2020
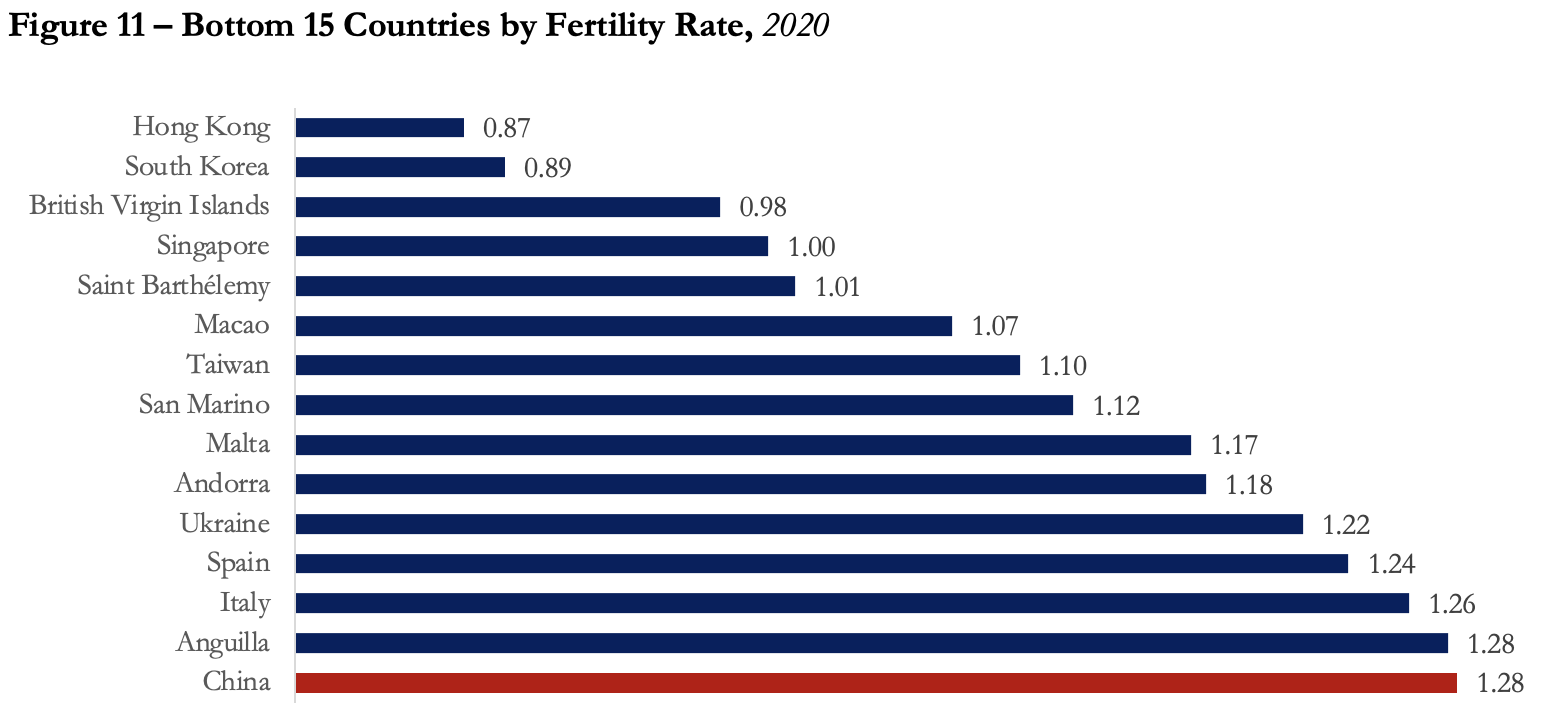
Source: United Nations 2022 World Population Prospects.
This trend of lower births continued into 2021, in addition to a higher number of recorded deaths, which further cut the natural change by 1.57 million. The starker change, though, happened in 2022 when the number of deaths exceeded the number of births, as the former continued to rise and the latter to drop. As a result, the natural change turned negative and, with a negligible net migration rate, the Chinese population declined by 850 thousand persons; marking the first population drop since 1960. Figure 11 below visualizes the described population dynamics during the pandemic years.
Figure 11 – Population Changes by Component During the Pandemic, Thousands
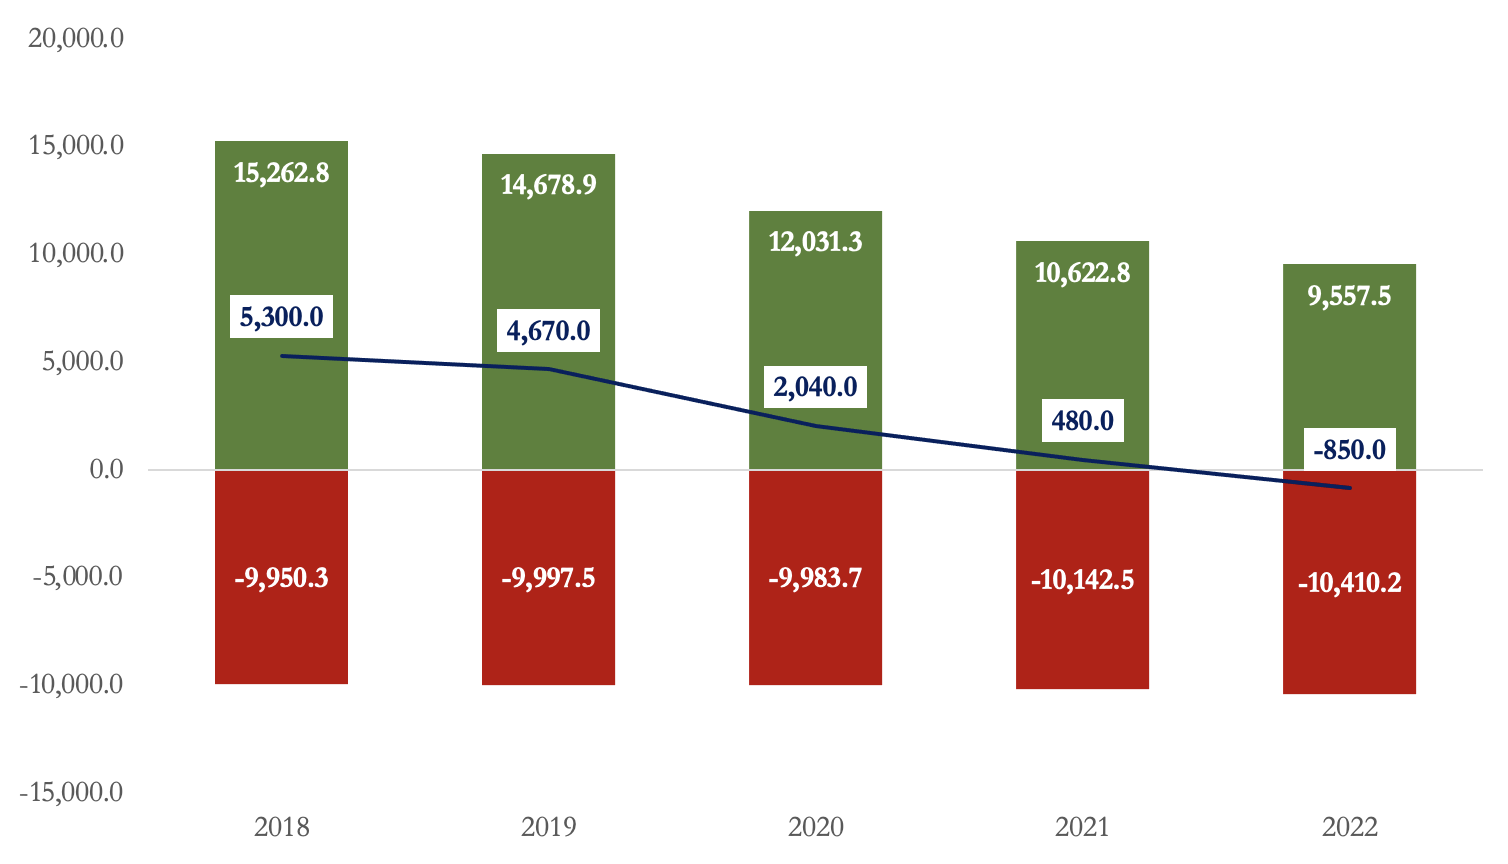
Source: National Bureau of Statistics of China.
Additionally, the pandemic has also caused a decline in immigration, which has been a key source of population growth for China in recent years. China has only recently allowed travel to resume both inside and outside of the country.
According to estimates by the United Nations (UN), this new declining trend of the Chinese population is set to mark a change in global population rankings. India, which competes with China for the most populous country, is projected to take over from China this year (Figure 12). The total Indian population is expected to stand at 1.4417 billion in July 2023, according to UN calculations (blue line). This figure is already higher than the end-2022 national estimate of the Chinese population (solid red line) and will even surpass the slightly higher UN projection for the Chinese population (dashed red line). By 2024, It is estimated that India will account for 17.8% of the global population, while China will come in second place at 17.6%.
Figure 12 – Total Populations in China and India, 2010-2023, Millions
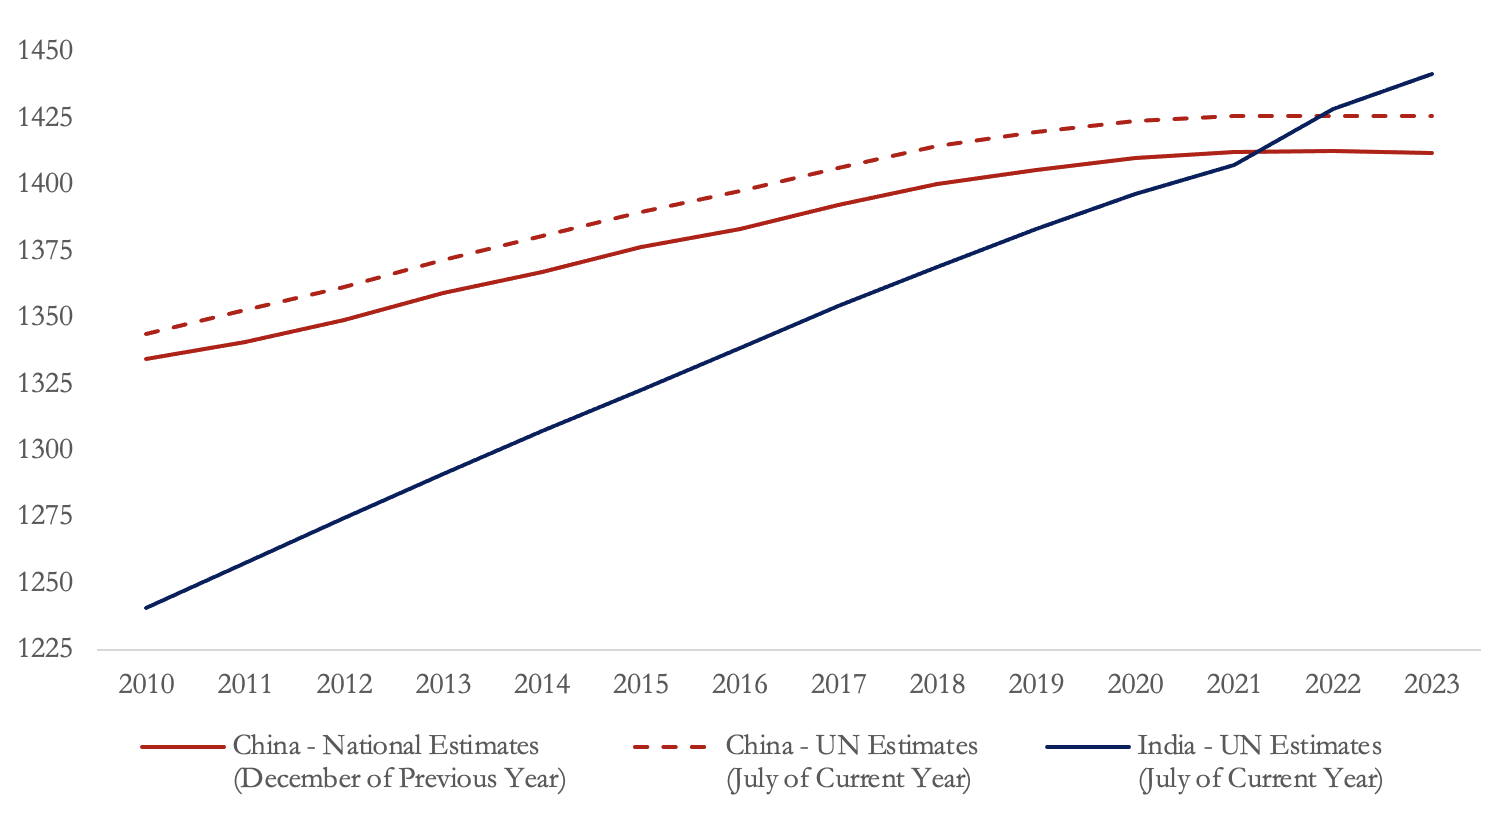
Source: National Bureau of Statistics of China and United Nations 2022 World Population Prospects.
Future Population Demographics: Looking Forward to 2050
Looking forward to 2050, China’s population will continue to age rapidly, and the working-age population will decline. According to future population projections by the Shanghai Academy of Social Sciences, the Chinese population has already peaked, and this last decline will mark a continued trend moving forward (Figure 13). The 2022 population is projected to decline by 16% to reach 1.18 billion in 2050 (1993 level), then by a further 50%, reaching 587.3 million in 2100 (1953 level).
Figure 13 – Future Chinese Population, 2022 –2100, Millions
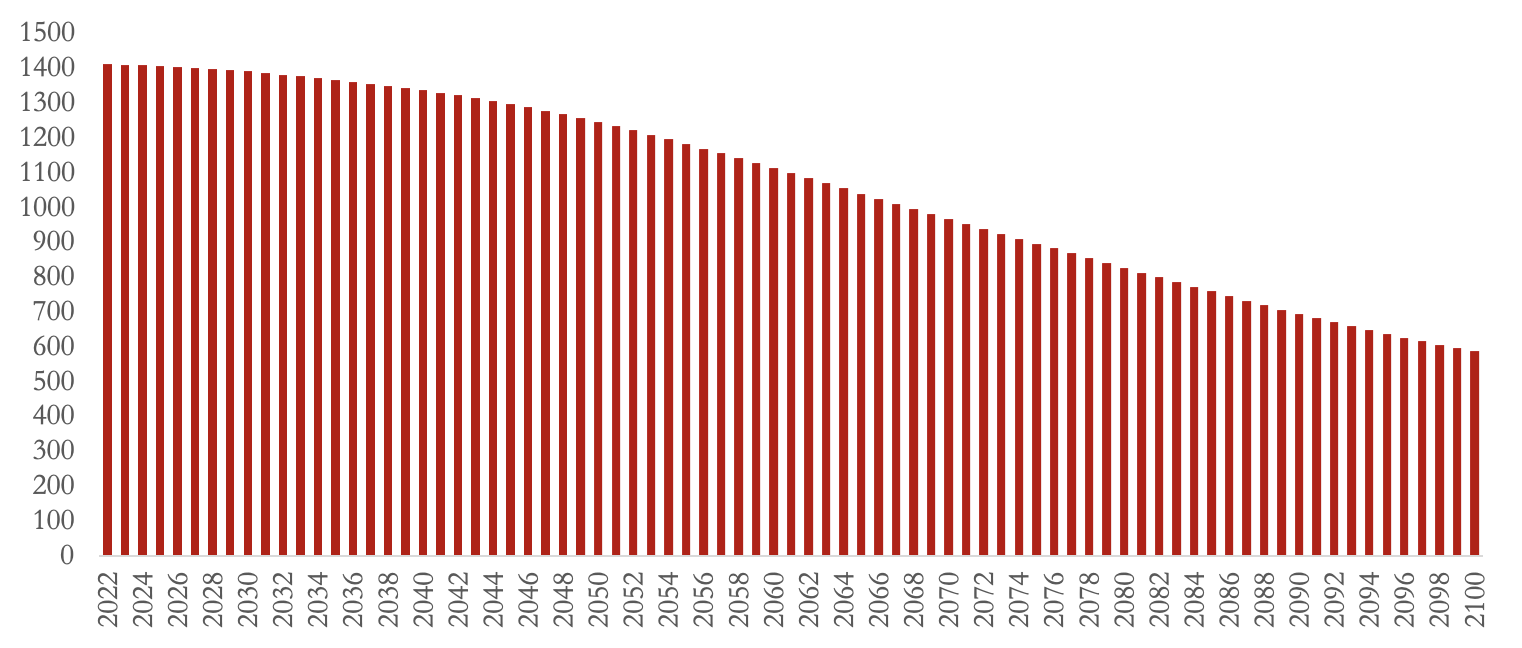
Source: Projections by Shanghai Academy of Social Sciences retrieved from the Conversation.
According to different projections by the UN World Population Prospects, while the trend will be similar, the population decline will be less steep. The UN expects the Chinese population to drop by only 7% up to 2050, reaching 1.32 billion (2006 level), then by a further 41% up to 2100, to reach 771.3 million (1965 level).
Also, the United Nations estimates that the proportion of China’s population aged 65 and over will reach 34% by 2050, while the proportion of the working-age population will decline to 51%, due to the low birth rate and aging population. Similar to other countries with aging populations, the Chinese population pyramid has evolved over the years to reflect the age shifts (Figure 14). As covered in previous articles on other countries, the change has been characterized by three changes: A narrowing bottom due to low births not replacing the aging young, a shrinking middle as the working-age population declines, and a broadening top as the society ages and life expectancy increases. The difference between China and other high-income aging societies such as in the EU and Japan, however, is that it is still in a relatively earlier stage. In fact, the Chinese population pyramid in 2019 seems like a middle version between the Japanese pyramids of 1960 and 2019 (as presented in the previous article of this series). It is true that the aging process in China has been rapid in recent years, probably exacerbated by the strict historical one-child policy. While this does raise concern, the earlier stage of the problem sparks some hope for policy measures to be effective as will be discussed in the next section.
Figure 14 – China’s Population Pyramids, 1960, 2019, and 2100, % Total Population
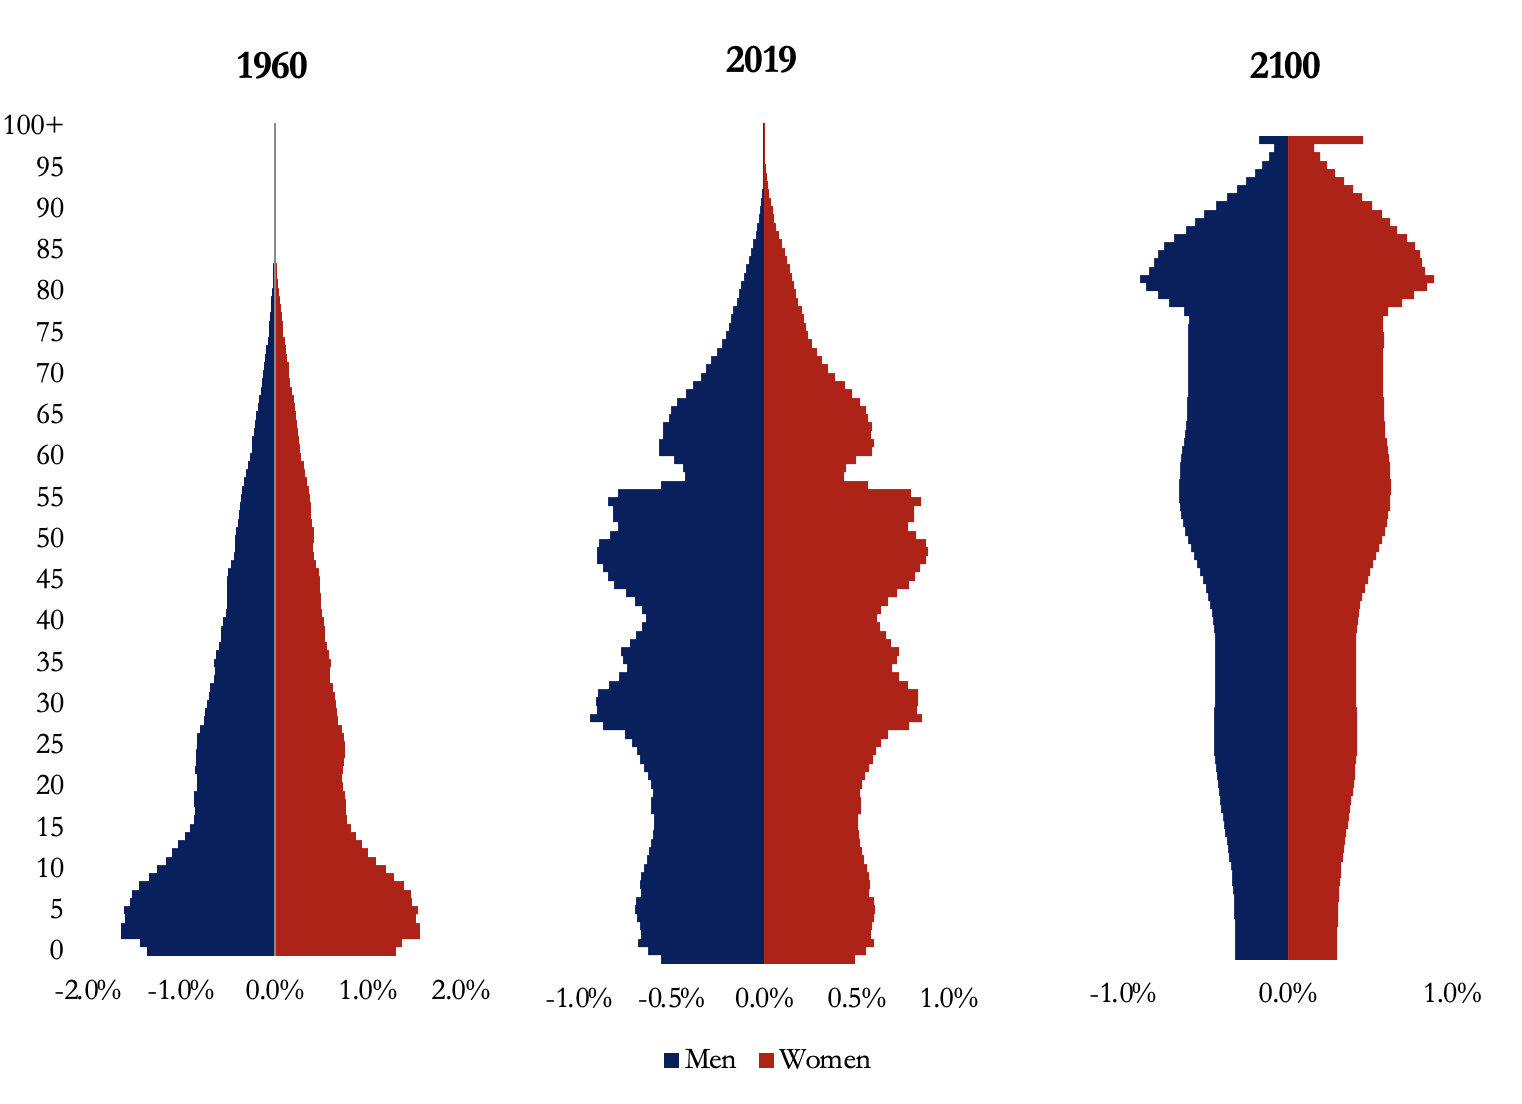
Source: United Nations 2022 World Population Prospects.
Figure 15 below presents the population and age demographics for China in 2022, 2050, and 2100. The share of the old population, those 65 years of age and above, will reach 30% by 2050 and 40.9% by 2100. Even worse, the share of the very old population, those 80 years of age and above, will increase ten-fold by 2100 to reach 23%, from 2.4% in 2022. Moreover, the median age will be close to 57 years in 2100, with a much higher life expectancy of 90 years. Despite its current less severe state of aging, given the very rapid population shifts, in 2100 China’s demographic figures will be very similar to those of Japan (despite Japan’s current higher aging level). In other words, if China continues with the current trend without rapidly implementing effective policies, the situation will only get worse.
Figure 15 – Future Chinese Population Demographics
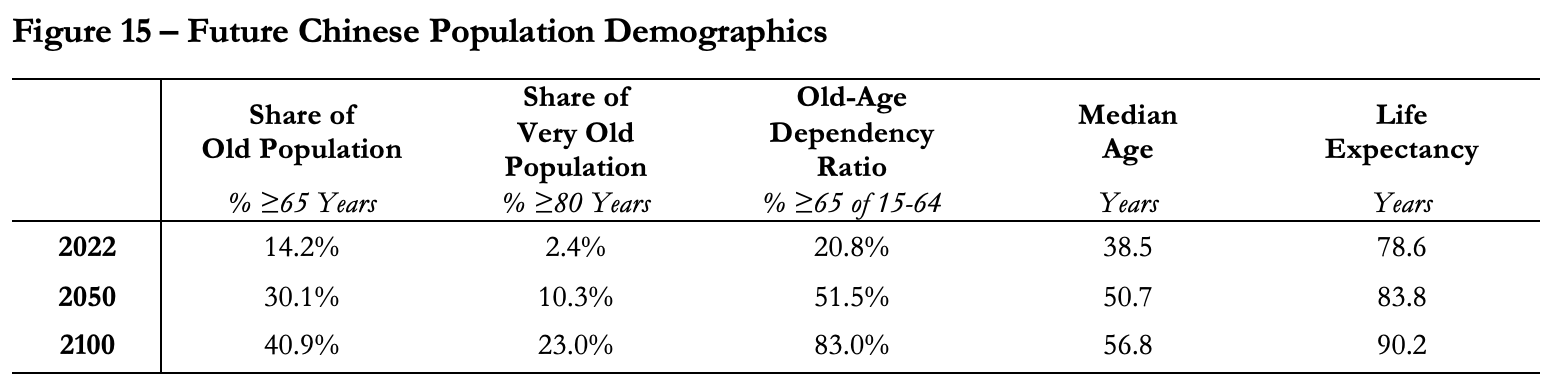
Source: National Bureau of Statistics of China and United Nations 2022 World Population Prospects.
What Does This Mean for the Chinese Economy and Can It Be Mitigated?
The population decrease in China does not come as a surprise. The one-child policy was strictly enforced for 35 years to curb population growth. It succeeded. But how much of a threat is a shrinking population to the Chinese economy? China’s working-age population has already started declining, as it seems to have peaked at around 1,010.4 billion in 2013, before declining by 13% to reach 875.6 million in 2022 (Figure 16).
Figure 16 – Chinese Working-Age Population, 1960-2021, Millions
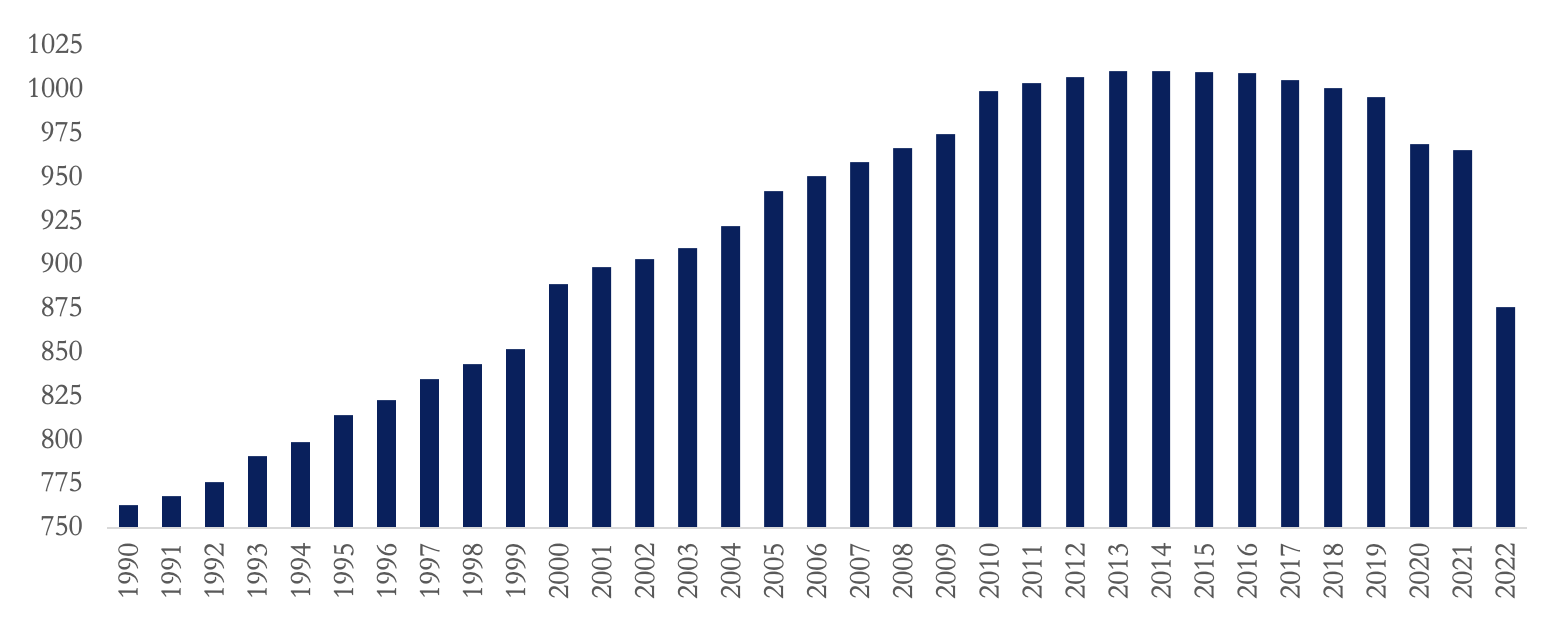
Source: National Bureau of Statistics of China.
In turn, the elderly population has been rapidly increasing and is expected to dramatically increase further. Figure 17 shows projections by the Shanghai Academy of Social Sciences. The number of those 65 and older is expected to double by 2050, reaching 409.6 million, compared to 209.8 million in 2022. Moreover, the elderly population is expected to surpass the working-age population starting in 2080, as the former is forecasted to drop 50% by 2080 (382.8 million) and 70% by 2050 (249.8 million).
Figure 17 – Chinese Working-Age and Elderly Populations, 2022-2100, Millions
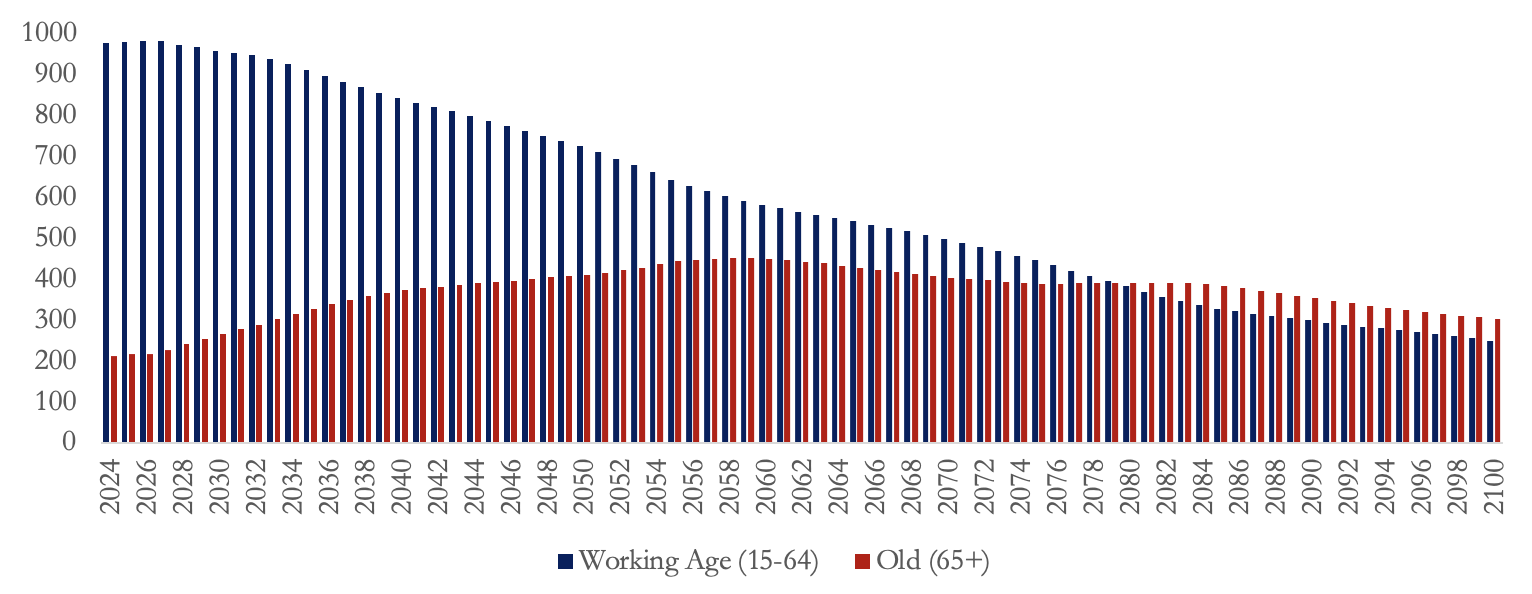
Source: Projections by Shanghai Academy of Social Sciences retrieved from the Conversation.
The declines in the working-age and increase in the elderly population are expected to exert much pressure on the Chinese economy. First, challenges to maintaining high productivity might exist as the labor force shrinks. Second, as the working cohort shrinks, a narrower base will be available to fund the bloating pension system. Third, a wider old cohort will require directing more resources to long-term healthcare and assisted living. All this will exert a greater burden on the Chinese government to provide for its citizens and maintain high productivity. A recent study found that China’s business dynamism declined between 2003 and 2018, citing an aging population as one of the potential contributors. The recent actions by the US to limit high end chip sales and technology transfers will create additional speedbumps for the Chinese economy especially impacting productivity.
In addition, this demographic shift poses significant challenges for China’s economy, including a decline in the demand for goods and services, a potential decline in real estate prices and slower economic growth. The impact of a declining Chinese population will not be limited to China but is also expected to leave a mark on the global economy. China is a major economic and trade player. A slowing Chinese economy could impact global growth, with potential shifts in the major economic players. India, for example, is expected to be a big winner as it gains economic momentum over China.
However, a declining Chinese population could also present some benefits to the country and the World, including reduced overcrowding, better resource utilization, easier poverty eradication, fairer wages through higher labor competition, and a better likelihood of meeting climate targets through lower population density, reduced pollution, and higher energy efficiency.
Given China is still a highly populous country and that its population only recently started declining, there is a lot that the country can do to mitigate the issue. The government has already started embarking on policies to increase fertility, including better maternity leaves, tax reductions and benefits to families, cash incentives to encourage births, and the three-child policy that allows parents to have three children and incentivizes them to do so, including through financial support. However, such policies have often been criticized for being ineffective. Evidence shows that young citizens are already resisting getting married and having babies.
Other measures that increase the productivity of the labor force through building human capital, including improved education and health, should be more impactful. Moreover, by investing in the health and productivity of the elderly population, China can effectively maintain a “younger” economy by maintaining a highly productive and healthy old cohort. Recent analysis finds that when adjusting for health differences, many of the countries with older populations are actually similar or more productive than others with younger populations that are disease-burdened. In other words, the association between increasing age and declining productivity is not linear, but rather highly dependent on health. Moreover, automation is another important factor that determines the productivity of the population in general and the elderly in particular. Investing in advanced technologies is thus critical in such a manner.
Measures to increase the Chinese retirement age can be effective in prolonging labor force participation. China’s current retirement age is 60 for men and between 50 and 55 for women, which are some of the earliest retirement ages in the World. Legally postponing the retirement age and penalizing early retirement through pension cuts can reduce the pressure on the pension system and mitigate the decline in the labor force.
Moreover, increasing female labor force participation is an important factor that China needs to work on. This starts by addressing the high gender pay gap and inequality in job opportunities. Moreover, providing affordable childcare is important to encourage working females to have babies and mothers to remain in the labor force.
Final Thoughts
The Chinese population dynamics are shifting rapidly, and the time to act is now or never. As explored in this article, the population trends and demographics prior to the pandemic have already presented challenges to the Chinese economy, and the pandemic has only exacerbated these issues. With a rapidly aging population, declining birth rates, and increasing healthcare costs, China must take proactive steps to mitigate these challenges if it hopes to maintain its economic growth and stability. Looking forward to 2050, it is clear that these demographic changes will have a profound impact on the Chinese economy. With strategic planning, investments in education and healthcare, and policy changes to support working families, there is hope that China can successfully navigate these challenges and emerge stronger than ever.
Yet, this is unlike national industrial policy where China’s leaders can pick an industry and provide massive funding to grow it. Human beings may not react to given incentives to reproduce even if there are large subsidies. The key for family formations is typically hope for the future, the willingness to sacrifice for the newborns and employment. If family formation with children falls due to these conditions, it will be impossible to change the trajectory of China’s demographics.