“As always, there is no preset path for policy. And particularly with muted inflation readings that we’ve seen coming in, we will be patient as we watch to see how the economy evolves.” (1)
On January 4, 2019, Federal Reserve Chairman Jerome Powell made these comments and ignited a stock market rally that has become one of the best quarters for equities in 10 years. This was in stark contrast to the Fed’s Federal Open Markets Committee (FOMC) December 21,, 2018, meeting in which interest rates were raised for the 9th time in 3 years, members projected 2 additional rate hikes in 2019, and the S&P 500 marked the worst December since 1931. These sharp movements generated from Federal Reserve actions and words are precisely why analysts, researchers and traders focus intently on the central bank. As discussed in our previous article, the Fed is equal to the Sun in our financial universe; with the strongest gravitational pull on the market/economic narrative.
Given the central bank’s prominence in the financial markets, this article will briefly review unconventional monetary policy, current monetary policy, and project the problems the Fed will encounter should a recession/slow growth period return. The goal is not to be exhaustive, but to provide context for understanding what the central bank has done, is doing, and will do in the future.
Key Takeaway: The biggest risk for the markets is the next recession when the Fed may not be able to successfully stimulate growth either through large interest rate cuts or large enough Quantitative Easing (QE) programs to make a substantial impact.
Unconventional Monetary Policy: forward guidance and quantitative easing
The basis for unconventional monetary policy grew out of the Federal Reserve cutting interest rates to effectively zero and needing more to stimulate the US economy. The chart below illustrates the problem the central bank faced at that time.
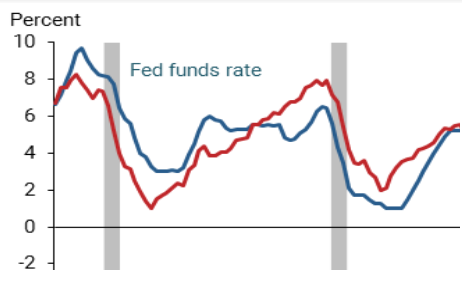
Source: SF Federal Reserve
Federal Funds would have needed not merely to go negative, but go severely negative to over -7%.
The Federal Reserve began to engage in quantitative easing for a set of four asset purchase programs to influence interest rates. The table below lists the four program rounds and their size.
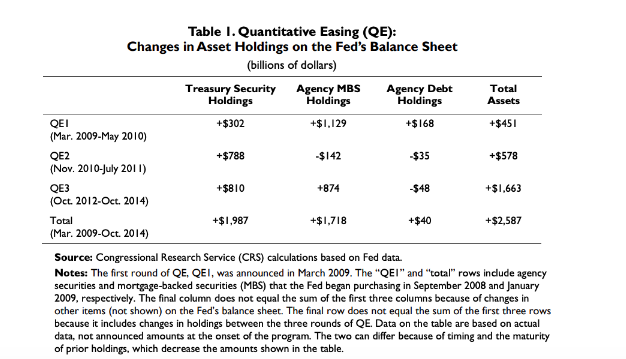
Source: Congressional Research Service (2)
These programs took the Federal Reserve balance sheet from below $900 billion to over $4.5 trillion. How did they do? The event studies listed below suggest the four policies cumulative effects on the 10-year Treasury yield totaled at least -150 basis points. (3)
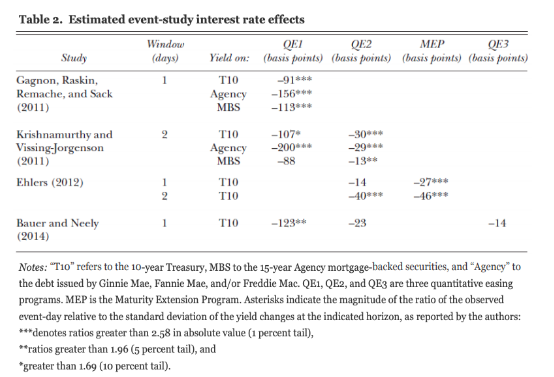
Source: Brookings (4)
It is important to keep in mind that the QE1 announcement had the largest impact and subsequent QE announcements were much smaller. In other words, each program had less “bang-for-the-buck” or drop in rates per amount of QE.
In January 2012, the central bank began to offer forward guidance on the future of short-term interest rates and the associated participants’ numerical projections of fed funds rate or “dot plots.” The forward guidance goals were to push down expectations of future short rates, lower longer-term yields, and ease financial conditions. According to research (Rudebusch 2018) (5), this forward guidance worked as predicted and helped push down market expectations, reduced longer-term yields, and eased overall financial conditions. (6)
While the macroeconomic effects of quantitative easing are difficult to separate, research shows these changes: unemployment reduced by 1.0-1.2% and GDP increased 3.5% under QE1, 1% under QE2, and 0.4% under QE3.
Exit Strategy: Current monetary policy
On May 22nd, 2013, then Federal Reserve Chairman Ben Bernanke stated, “If we see continued improvement and we have confidence that that’s going to be sustained then we could in the next few meetings … take a step down in our pace of purchases.” (7) These comments surprised the markets and led to the now-famous “Taper Tantrum” where bond yields soared and stock prices swooned. These comments and the market’s reaction helped delay the actual beginning of the tapering program to end quantitative easing. The actual tapering began on December 18th, 2013. On October 29, 2014, the central bank announced it would end all large-scale asset purchases.
The Federal Reserve then waited until December 16, 2015, to raise the level of the Federal Funds rate by 25 basis points. The chart below shows the progression of the nine rate hikes.
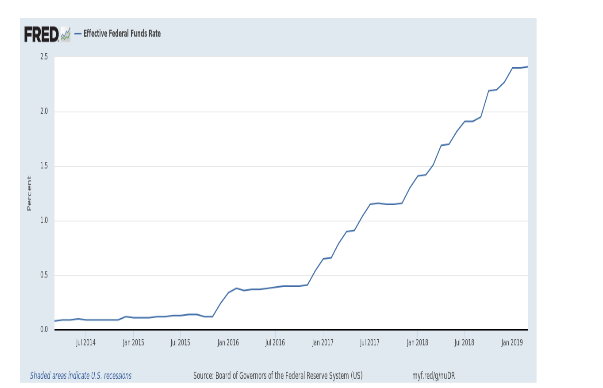
Source: St. Louis Federal Reserve (4)
Beginning in 2017, the US central bank began a program of quantitative tightening (QT) whereby it would begin to reduce its holdings of securities or balance sheet. The table below shows the scheduled reduction by months of the program, which began in October of 2017.
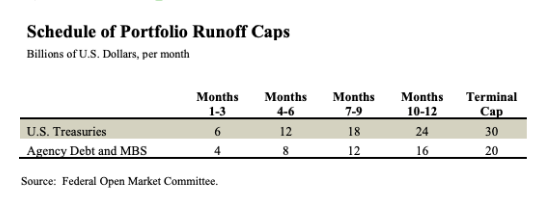
The combination of interest rate hikes, balance sheet reduction, larger US Treasury issuance, and strong 2018 economic growth led US interest rates higher with the US 10-year Treasury note breaching 3.25% in the fall of 2018. The peak run-off of the Federal Reserve QT program occurred in October of 2018. The chart below shows the 10-year yield and the S&P 500. The dramatic drop to the lows of December 24, 2018, is highlighted
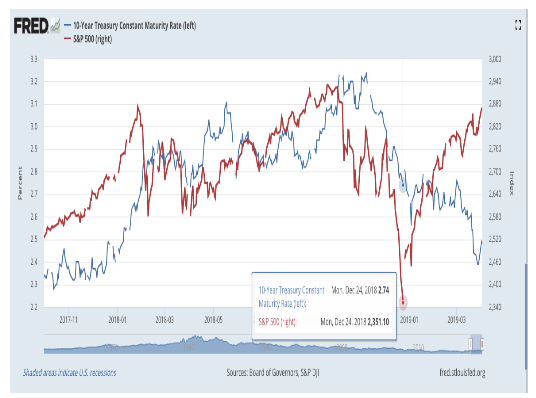
Source: St. Louis Federal Reserve
Along with stock and bond market volatility, a major challenge facing policy makers is the inability of inflation to rise despite strong economic growth in 2018. The chart below shows the Fed’s preferred inflation measure; core Personal Consumption Expenditures (PCE), with Consumer Price Index (CPI). The Fed has a 2.0% inflation target for core PCE, which has only been briefly met since the 2008 financial crisis. This calls into question whether they should be increasing rates at all until the target has been consistently met.
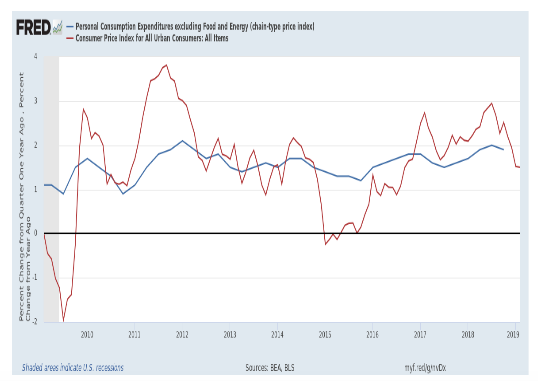
Source: St. Louis Federal Reserve
Reacting to the sharp equity market selloff in December, and with inflation tame, Chairman Jerome Powell began to openly discuss a delay or pause of the FOMC participant projected rate hikes for 2019. While the FOMC officially has been on hold for the first two meetings of this year, it has not stopped or paused the balance sheet reduction program. As of this writing, the assets are now just below $4.0 trillion.
Problems for the Fed
There are unintended consequences of unconventional monetary policy and there are future policy problems for the central bank for the next recession.
The unintended consequences for the central bank are twofold: yield curve signaling and equity market dependence. On signaling, the US yield curve has been a relatively accurate predictor of US recessions when it becomes inverted. The chart below shows the 10-year US Treasury constant maturity yield less the 2-year Treasury constant maturity since 1976, with the shaded areas indicating US recessions. With a lag between 1-1.5 years, yield curve inversion has been a market barometer for recession worry and remains so today.
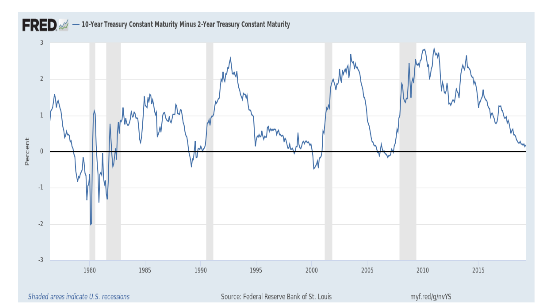
Source: St. Louis Federal Reserve
The problem with the Fed’s QE programs lies with the goal and success of the programs: to reduce both short-term and long-term rates. This led to a flattening of the yield curve, which occurred prior to the Fed starting their interest rate hikes. As the central bank has raised short-term rates, long-end rates didn’t rise in a commensurate fashion, thus, the curve flattened to the point where an inversion did occur between the US Treasury 3 month T-bill and the 10-year note. This was the first time this has happened since mid-2007, (8) which, at that time, accurately predicted the next recession. Thus, the Fed has created the conditions where the yield curve predicts a recession due to the success of the QE programs and the recent attempt to normalize interest rate policy by raising interest rates. Note, the balance sheet reductions don’t appear to have as large an impact on pushing up longer-term interest rates, which would have helped steepen the curve.
As a heuristic, the equity markets believe the “don’t-fight-the-Fed” mantra. If the central bank is raising rates, this is perceived as negative for the economy, profits, and earnings (under discounted cash flow analysis). The reverse is seen as true as well. Since the beginning of the recent Fed tightening program, and as the yield curve has flattened, the equity markets have included this as a concern. While it didn’t have a negative impact on values until the 2nd half of 2018, the worries over the yield curve inversion and Fed tightening (along with trade concerns and global economic slowdown) helped drop the S&P 500 almost 20% by the end of December. This drop, or financial market condition tightening, led Fed Chairman Jerome Powell to make his January 4, 2019, comments about stopping rate hikes and becoming patient. In turn, this led to a tremendous short-term rally in the equity markets. The problem the central bank faces is that it is perceived as the most important component of the financial markets and the economy. To be sure, its dramatic insertion into both has generated positive impacts. However, now these appear to be dependent on easy money policies and not on organic growth without low interest rates.
Most critically, the Fed will likely begin the next recession with a drastically reduced capability to stimulate the US economy. First, the US economy has grown over $3.5 trillion since 2009. As an example, a fixed $100 billion purchase of securities will generally cause a smaller ripple in the bond market and a smaller effect on term premia. (9) This translates into a need for 20% increase in the size of the QE program to have a similar impact. Given the lessening impact of each successive QE program, this 20% may be substantially low as there will be no “shock and awe” to the announcement of new QE stimulus.
If a recession started this year, the Fed would also be hamstrung by the already low level of interest rates and would be stuck at the zero bound level. In 2007, the Federal Reserve had raised interest rates 17 times by 25 basis points each occurrence, reaching 5.25%. This gave them 525 basis points of rate cuts to use during the 2008 financial crisis as the first wall of defense to stimulate the economy. Now, they only have 250 basis points to use.
This does raise the question of whether the Fed could pursue a negative interest rate policy similar to Europe and Japan. Recent research (Curdia 2019) (10) suggests a negative effective bound of -0.75% would have reduced the severity of the 2008 recession. (11) But negative interest rates would potentially put the Fed in the same difficult position that the European Central Bank and the Bank of Japan are in today; negative interest rates with quantitative easing and very slow growth in both markets. The question remains: how negative do they go to stimulate and what impact will this have on the financial system’s stability?
Conclusion
In this era of unconventional monetary policy, the US central bank faces challenges to normalize interest policy without causing the next recession. And it’s the next recession that poses an even greater challenge to the Fed as its ability to stimulate the economy will be hindered by a low starting level of interest rates and a need to use larger and larger amounts of asset purchases to attain the same impact of the previous QE programs. Most likely, these are the conditions which caused Chairman Jerome Powell to state his “patient” view as a preemptive step towards the next recession.
___________________________________________________________________________________________________________________
- https://www.cnbc.com/2019/01/04/powell-says-fed-will-be-patient-with-monetary-policy-as-they-watch-how-economy-does.html
- https://fas.org/sgp/crs/misc/RL30354.pdf
- https://www.brookings.edu/wp-content/uploads/2018/10/WP47-Kuttner.pdf
- https://www.brookings.edu/wp-content/uploads/2018/10/WP47-Kuttner.pdf
- https://www.frbsf.org/economic-research/publications/economic-letter/2018/december/review-of-unconventional-monetary-policy/
- https://www.frbsf.org/economic-research/publications/economic-letter/2018/december/review-of-unconventional-monetary-policy/
- https://www.reuters.com/article/us-usa-fed-2013-timeline/key-events-for-the-fed-in-2013-the-year-of-the-taper-tantrum-idUSKCN1P52A8
- https://www.cnbc.com/2019/03/25/the-us-bond-yield-curve-has-inverted-heres-what-it-means.html
- https://www.frbsf.org/economic-research/publications/economic-letter/2018/december/review-of-unconventional-monetary-policy/
- https://www.frbsf.org/economic-research/publications/economic-letter/2019/february/how-much-could-negative-rates-have-helped-recovery/
- https://www.frbsf.org/economic-research/publications/economic-letter/2019/february/how-much-could-negative-rates-have-helped-recovery/