It is almost impossible to see beyond the horror of refrigerated trucks in New York City full of recently passed coronavirus victims and the devastating losses to families. In addition, it’s almost impossible to ignore the crushing blow of an economic shutdown on lower income and middle-income workers in a wide range of industries. The economic repercussions of the coronavirus could even culminate in job losses not seen since the 1930s.
The most likely outcome will be the reopening of the economy before June 1st, where most healthcare experts recommend (12 weeks). I expect President Trump to announce the target date of May 1st. This could come in the form of rolling re-openings with manufacturing, construction and financial services as good candidates for returning to work in the initial phase (many financial services are already operating remotely). Manufacturing and construction employ more people in the United States (20 million) than leisure and hospitality (16 million), and their share of economic output (23 percent) is even greater than their share of employment (12.4 percent).
This article reviews recent research and new statistical methods to construct a framework that covers the next three months, with the aim of providing context for what the future may hold. Given the rapidly changing nature of the pandemic, the conclusions may be outdated by the time this article is published.
In recent history, we have had little experience with pandemics and the time frames over which they impact the global economy and markets. Pandemics are so rare in general that it becomes difficult to predict economic outcomes that result from them, and to make reasonable economic decisions within the pandemic context. Even during the 1918 Spanish Flu outbreak, there was little mention of it as a factor influencing the financial markets.
An important fact to remember is that governments around the world are not trying to eradicate the virus. Rather, they are attempting to delay the full exposure to the population while sufficient healthcare capacity can be attained to address the peak of the infection. This should result in the “smoothing” of the infection curve from a massive peak to a series of smaller peaks while elongating the time frame from peak to trough. This strategy affords time for “herd immunity” to form as the population survives and becomes resistant to the virus. In addition, it stops healthcare systems from being rapidly overwhelmed, and spreads the healthcare load over a longer time frame. For the purposes of this article, we’ll focus on the 3-month outlook for the economy and virus.
Key takeaways: The optimal healthcare time frame for social distancing to smooth the infection curve is 10-12 weeks, which can reduce the spread of the virus from a potential peak infection rate of 24.4% to a lower peak infection rate of 5.6% of the population. The optimal time frame for reopening the US economy is not 10-12 weeks, but much shorter. Ideally the economy would be restarted as soon as sufficient healthcare capacity (testing, gear, medications) is available to handle the surge.
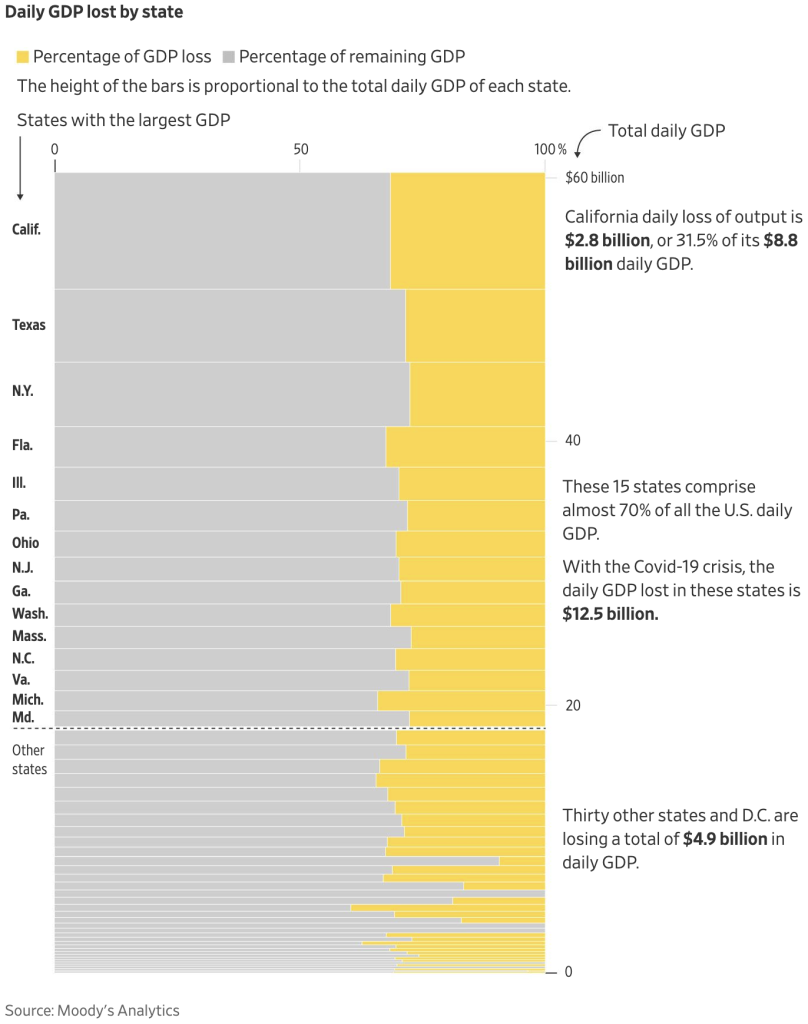
Based on the CDC program (“15 days To Slow The Spread”) established on March 16th (“30 Days To Slow The Spread”) and extended to April 30th, the longest time frame scenario for the economic shutdown should be June 1st. If 75% of the US economy is shut down until June 1st, the economic hit could be $3.75 trillion or 15% of the yearly GDP over this period. On the flipside, one study found that without suppression measures being taken at all, “the economic cost of the virus [could] total over $9 trillion, which represents 43% of annual GDP.” The graph below from WSJ shows 82% of US counties are under lockdown and also displays the daily hit they take to their economic outputs.
The rapid stimulus responses by both the Federal Reserve and Congress will lessen the impact of the economic shutdown for businesses and will provide substantial backstopping of the financial system. Like social distancing, these initial measures are simply bridges constructed to get us beyond the next three months. As President Trump accurately stated on Saturday, “This country was not designed to be closed. The cure (shutdown) cannot be worse than the problem.”
A Collapse Never Seen Before: Short-term Indicators and What They Tell Us
Given the coronavirus (COVID-19) pandemic is not a business cycle or economic cycle event, we need to utilize a range of indicators to help understand the shutdown’s impact on the US economy and how far down we’ve fallen. I’ll provide a list of the top 5 indicators and an explanation of how to interpret them for the economy and the markets.
1. John Hopkins Coronavirus Map:
a. This map provides up-to-date information on the coronavirus in every country that is currently reporting data. US government officials and market participants are keenly focused on this indicator.
b. The map shows growth in the numbers of infections and deaths. These are used to estimate the death rate from the infection in each country.
c. Markets focus on the rate of change to see if the rate of infections and deaths is slowing down. Both Italy and Spain are showing early signs of this slowing process.
d. The biggest problem with the data is that the infections are measured as “reported infections”, which is not the same as actual infections. Due to lack of available tests in many countries, the actual number of infections is likely to be much higher than the reported infections. If the actual infections are significantly larger than the number of reported infections, then the percentage of deaths is actually much lower than the 12% rate currently reported in Italy or the current US rate of 2.7%.
2. US initial jobless claims:
a. Initial jobless claims is a data point issued by the U.S. Department of Labor as part of its weekly Unemployment Insurance Weekly Claims report.
b. Initial claims are first-time requests by unemployed people for the state unemployment agencies.
c. Similar to infections, the markets are looking at both the size of the claims and the rate of change to understand the extent of the coming impact on the unemployment rate and when it may lessen.
d. A declining rate (number of claims) would be seen as a leading indicator for when the economy is likely to stabilize or stop shrinking.
3. US continuing claims:
a. Similar to initial claims, this data point reflects how many unemployed people continue to draw unemployment benefits.
b. Market analysts watch for a 25-35% drop in continuing claims to indicate a rebound in economic activity.
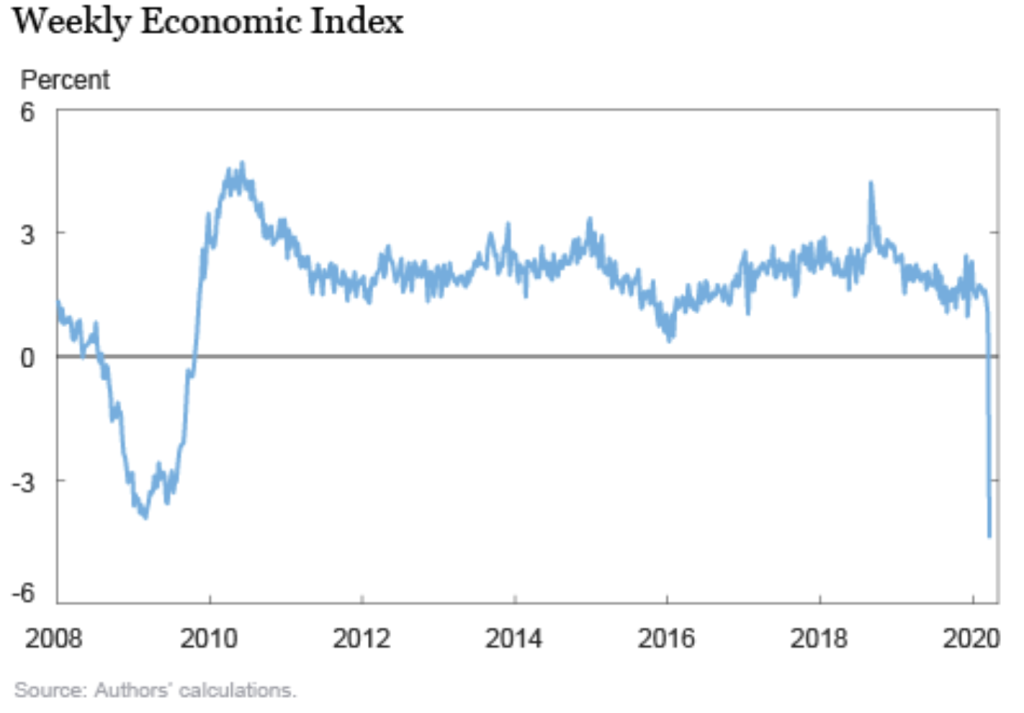
4. New York Federal Reserve Weekly Economic Index:
a. This is a new index created by the New York Federal Reserve to measure the expected GDP change over time. It is based on a number of factors including Redbook Research same store sales and initial jobless claims.
b. This indicator is used to understand how fast the economy is adjusting to the coronavirus shutdown and uses high frequency data to construct the index.
5. Atlanta Federal Reserve GDPNow and New York Federal Reserve NowCast:
a. Both of these GDP estimations are attempting to provide an interim forecast of the US GDP prior to the BEA Quarterly GDP. They are based on data (as it is released) that is used in the composition of the quarterly GDP report by the U.S. Bureau of Economic Analysis (BEA).
b. Simply, these measures are estimates as to the coronavirus impacts on GDP and have a higher frequency of changes (due to the fact that they are interim forecasts based on data as it is released).
Let’s take a look at each of these to see where they stand, so that we can get a sense of the US economy at the moment.
John Hopkins as of Saturday 4 April 2020, 5PM ET
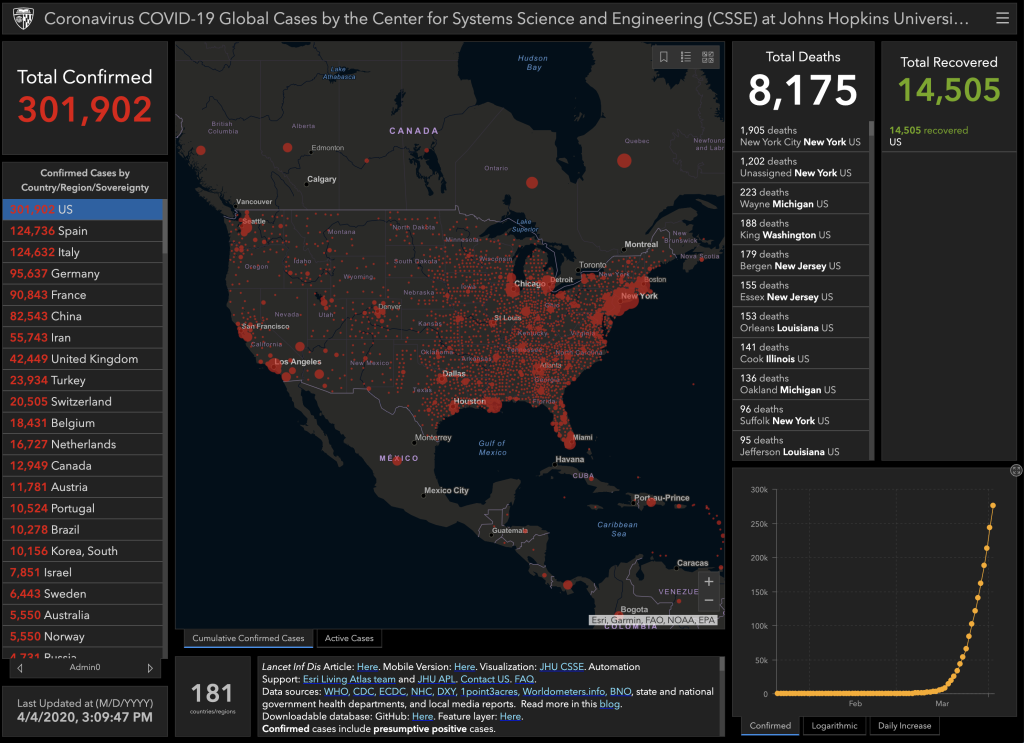
The mortality rate is 8175/301902 = 0.027, or 2.7%. By comparison, the seasonal flu infects 30 million Americans each year on average with a mortality rate of 0.001, or 0.1% for a yearly total of 30,000 deaths. If the coronavirus infects 30 million people, we would expect a death toll of 810,000. It is unclear at this point whether the coronavirus grants immunity that could carry over year-to-year, or whether people would be susceptible each year to re-infection like with influenza. Early indications point to some level of immunity. Again, the number of reported infected individuals appears to be significantly lower than the actual number infected and therefore, the actual mortality rate is likely lower than reported. As a result, we will likely see a significantly lower number of total deaths than this prediction.
US Initial Jobless Claims
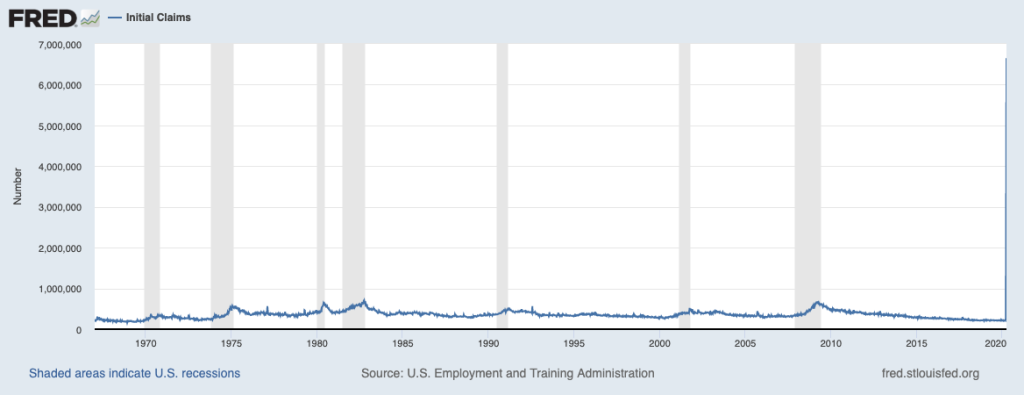
The surge of 6.6 million initial jobless claims was the largest number in one week ever recorded. As a comparison, 1.5 million jobless claims is equivalent to a 1% increase in the unemployment rate. Therefore, we would expect the unemployment rate to increase by 4.4 percentage points.
Continuing Claims
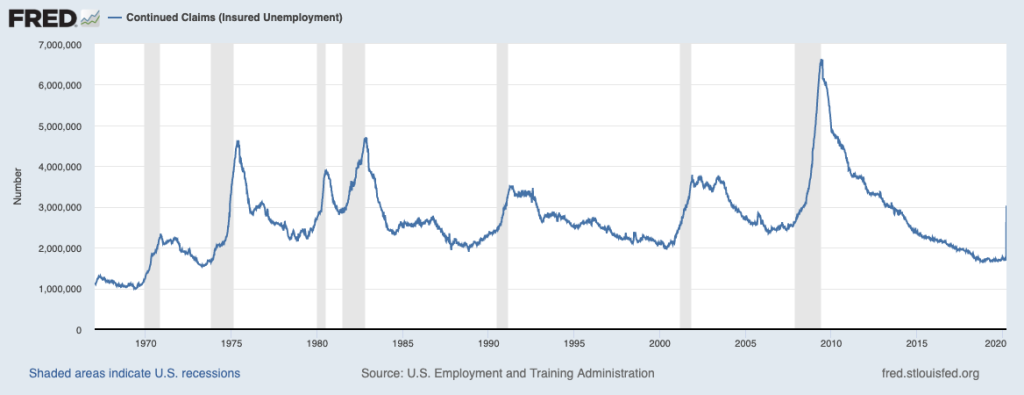
The number of continuing claims is currently well below the peak seen during the 2008-2009 financial crisis but is likely to surpass it quickly given the current shutdown. In addition, the 6.6 million initial jobless claims from the past week have not yet been able to make continuing claims, i.e. there is a lag in the data that is yet to be seen.
Federal Reserve Bank of New York Weekly Economic Index
The series can also produce estimates of upcoming data on other indices:
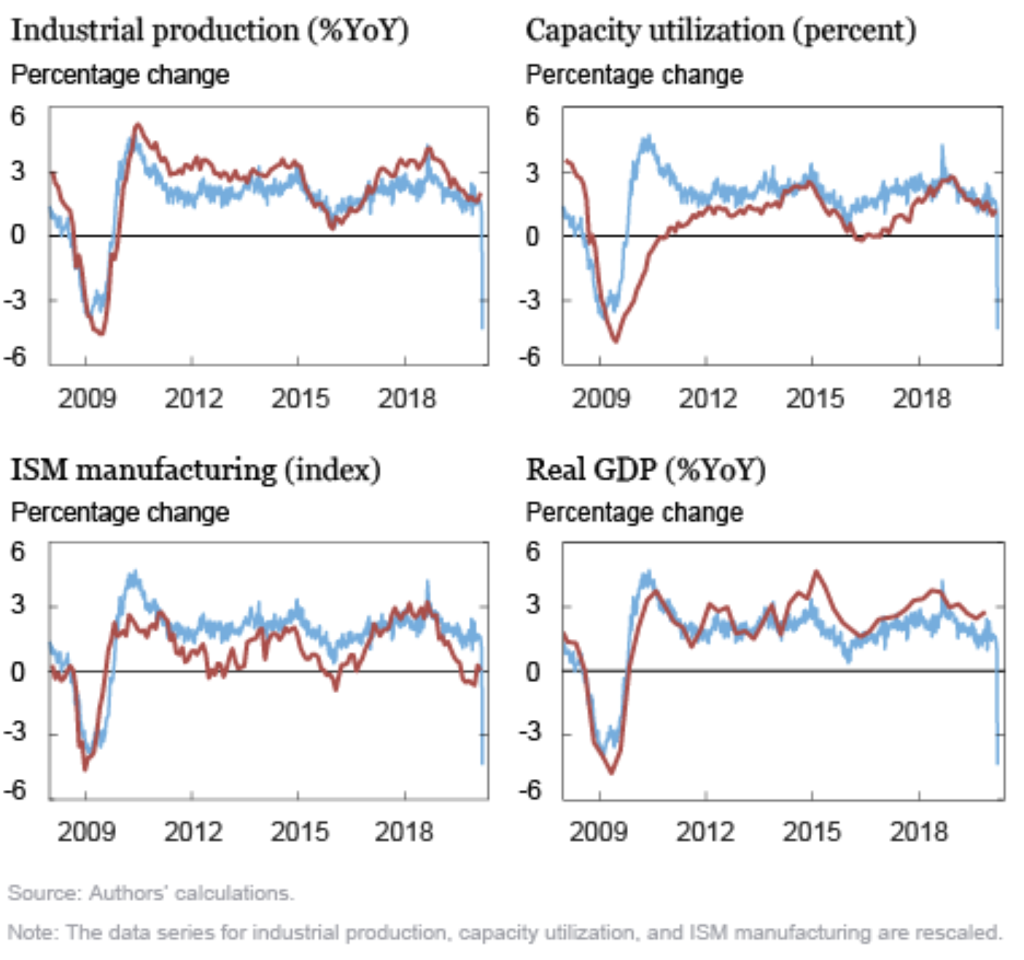
Note the 2020 Q2 Real GDP change estimate at the bottom right hand side of the Real GDP (%YoY) graph.
Federal Reserve Bank of Atlanta GDPNow
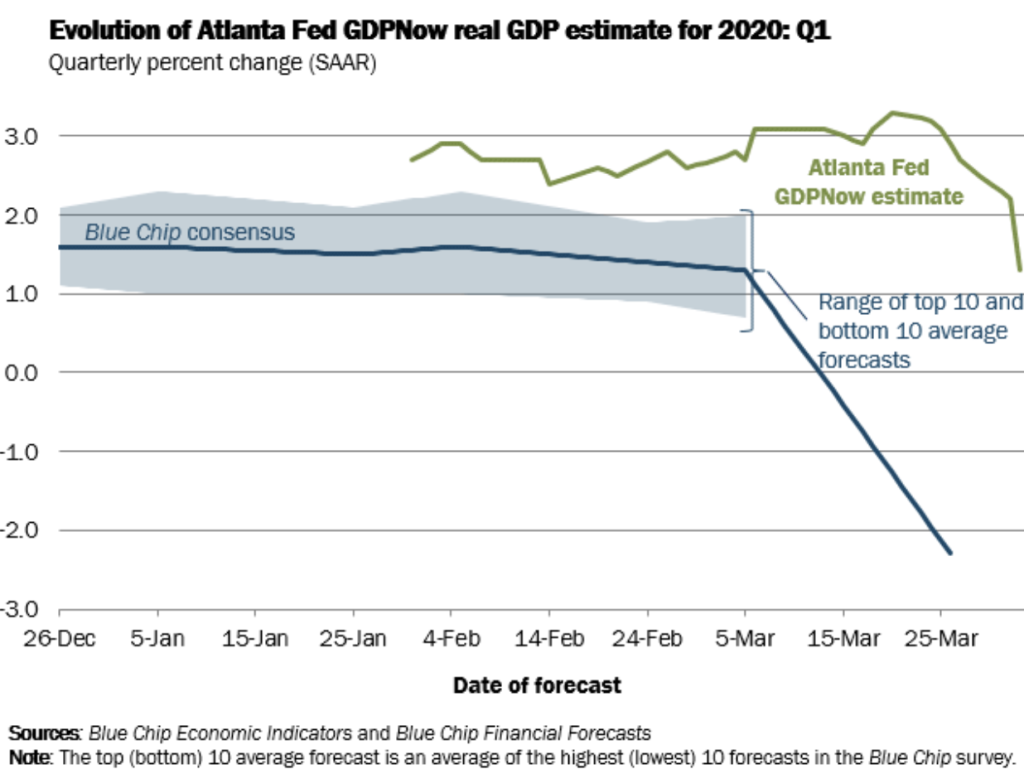
This graph indicates that both the Blue Chip Economic Forecasts and the Atlanta Fed GDPNow estimate are sinking fast under the weight of the US economic shutdown.
Federal Reserve Bank of New York NowCast
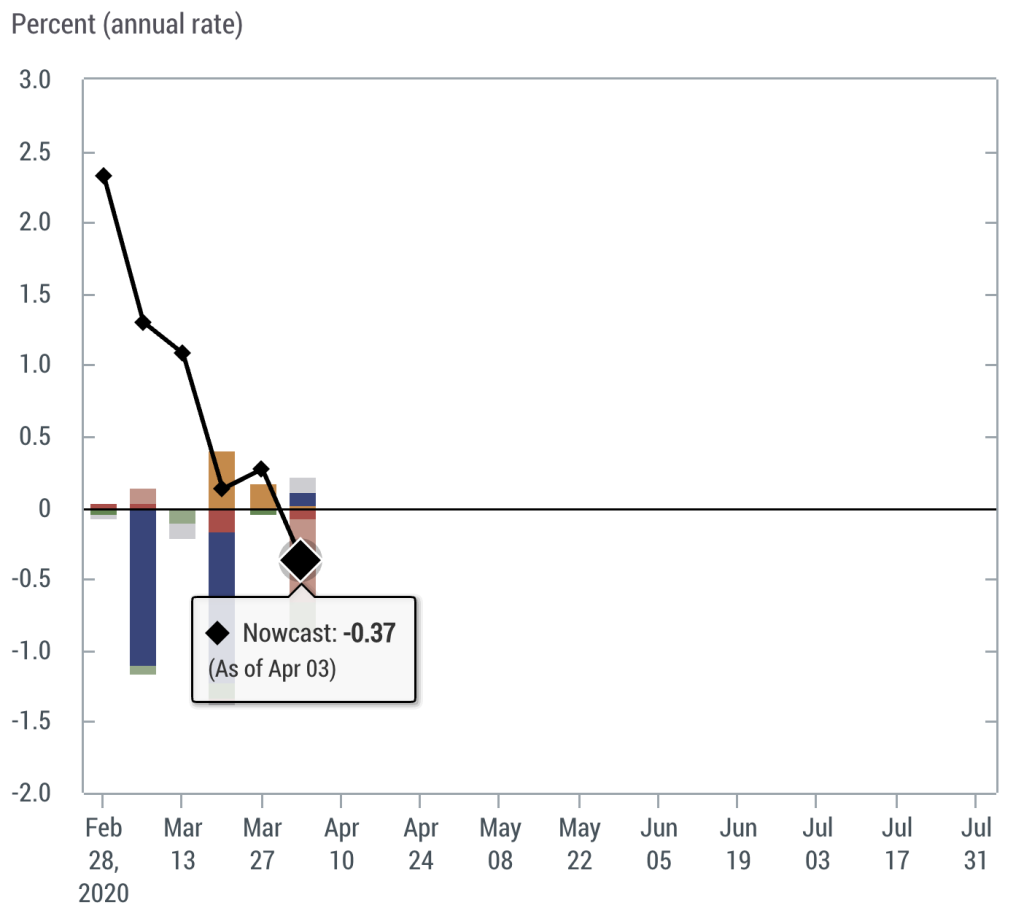
This is another clear estimate of negative US 2020 Q2 GDP growth in a rapidly deteriorating economy.
Summing this up, the US economy and employment is in a free-fall unlike anything our country has experienced before over such a short time frame. This is unsustainable and cannot be continued. This leads us to our outlook for what happens next.
3-month Outlook on The Virus and The Opening of the US Economy
The goal with both the US government and state government interventions is to slow the spread of the virus by shutting down parts of the economy and encouraging the practice of social distancing. As mentioned earlier, the goal of these social distancing actions is to slow the spread of the infection while healthcare capacity can be established. There is a balance to be struck between the damage to the health of the population and the damage to the health of the economy. As of this writing, the White House Coronavirus Task Force has not provided metrics to determine when they will believe the shutdown should be lifted. On Saturday April 4th 2020, President Trump said he’s “thinking about” forming a panel to examine how best to restart the country’s economy. If it is created, this panel will likely come to the same conclusion that May 1st should be the start of the economy reopening, and would provide political cover for the President to act on this basis.
Given the uncertainty over when the shutdown will be lifted, we need to begin to envision what the most likely outcome is over the next three months.
1. Based on CDC projections it appears that over the next 3 weeks, the estimated peak of infections will occur in the United States, similar to what Italy has experienced.
2. Over the next 30 days, there will likely be significant improvement in coronavirus tests, as well as the ability to accurately count the number of infections. In addition, time-to-result from tests will rapidly become shorter. This will allow for further containment of the virus.
a. In order, here is the progression of who will receive the testing:
i. All healthcare workers and patients. A fast, accurate test will allow healthcare personnel to quickly measure who has the virus and who will require hospitalisation as well as the need for PPE (personal protective equipment).
ii. All first responders. This is for the same reasons as above: to ensure they are safe and don’t spread the disease.
iii. All other essential workers: grocery store workers, sanitation staff, pharmacists, etc.
iv. Finally, the entire US population should be tested for both infection and antibodies, to determine the full extent of the infection, as well as who is immune to it.
b. This will require a massive production of tests alongside a massive buildout of testing areas.
3. Over the next 30-60 days, there will be significant increased production of PPE, respirators and quarantined bed space with better federal and state integration to assist “hot spots” in need.
4. Over the same time frame, several medications will likely be approved to reduce the severity of the disease and reduce the time frame within which patients recover.
5. Finally, protocols will be enacted at both the federal and state levels for going back to work based on a combination of testing, groups at lower risk, and strict business sanitation protocols. As mentioned above, a rolling re-opening of the US economy will likely take place with manufacturing, construction and financial services good candidates for returning to work in the initial phase.
6. The federal government will be the first mover to reduce restrictions, followed quickly by the states that are less affected. States with large outbreaks and larger economies will be laggards and risk extending the economic damage.
Conclusions
As stated above, the most likely outcome will be the reopening of the economy before the 10-12-week suggested shutdown period is up. I expect President Trump to announce the target date of May 1st.
The coronavirus situation and the US economy will look vastly different over the next three months. The darkest time will likely occur over the next 2-3 weeks as infections and deaths peak. The US economy will then be experiencing a self-induced depression, a prediction that is strongly supported by the short-term indicators provided above.
Yet, rapid progress is being made on multiple fronts to reduce the peak of infections to enable the healthcare system time to build capacity that can better handle the caseload. Rapid progress is being made to generate the critical supplies necessary to reduce the infections and save lives. Rapid progress is also being made to discover medications or immunizations that can reduce the mortality rate from COVID-19. All of this will speed the re-opening of the US economy before the virus has run its course.
This should have been handled like chicken pocks. Recovered Covid patients still possess dormant Covid, when will we see second, possibly multiple Waves of return??? Let’s just get it all over with all at once instead of dragging it on and on.
Great points, I’m hopeful that humans can develop immunity. Here’s a nice article describing what we know now: https://time.com/5810454/coronavirus-immunity-reinfection/
Here’s a great example of what I said in the article: the massive capability of US industry to produce necessary gear/products/ventilators for the outbreak.
https://www.cnbc.com/2020/04/08/coronavirus-latest-updates.html
All these makes sense, but the problem is even with the country reopenend, people are not going to consume the same way as before. Also, if you reopen too soon you risk another big wave of deaths and another shutdown, so not sure if the solution is ending the shutdown as soon as possible
Thanks for your comments!
Agreed, we are going to see a significantly different economic world and that’s why we’re creating the new O.A.T. research!
As far as reopening, this is all about providing time to create the healthcare capacity, therapies and PPE gear needed to deal with the virus. We’re going to be getting all three by the end of April with full-capacity by mid-May. In my opinion, we must reopen the economy as soon as possible or risk bigger problems. Ex: what happens if there is an exogenous event like North Korea either imploding or attacking South Korea? These risks take on bigger impact with the economy shut down.
Hello Andy, I saw your first O.A.T. video published April 19 2020 (great by the way!), and wanted to know where can I see the rest of the videos of this series O.A.T. that focuses on the rest of the areas of the Economy?
Hey sorry for the delay, we’re in the process of rolling out more shortly. Click subscribe on my YouTube page and you’ll get them as soon as they come out.
Armando, we published our 2nd in the OAT series with a YT as well.