Problems, Potential & Opportunities
Break Like the….(some Spinal Tap love to start)
Due to elevated research and development, advancements in production technology, and falling costs, wind power generation has grown substantially over the past three decades. Global Wind Energy Capacity has increased by a factor of almost 150 (from a low base) over the past four decades, standing at almost 900 GW in 2022. Global wind electricity generation has also followed, growing 60-fold since 2000, to reach 1,839 TWh in 2022. To put this in context, the United States generated about 4,178 billion kilowatt-hours (kWh) (or about 4.18 trillion kWh) of electricity at utility-scale electricity generation facilities in 2023 according to EIA. About 60% of this electricity generation was from fossil fuels—coal, natural gas, petroleum, and other gases.
The biggest chunk of wind generation comes from onshore rather than offshore wind, given it is cheaper and easier to install, despite the latter’s higher capacity factors provided by stronger sea winds. At the regional level, China dominates both onshore and offshore wind capacity and generation, with the U.S. and Europe playing an important role in onshore markets. However, while several European countries are major players in the offshore wind market, the U.S. is practically absent from this sector. such an industry.
The concept of using wind as a source of energy is not new. As early as 5,000 BC, people used wind energy to propel boats (sails) along the Nile River. Later in history, people in China used simple wind-powered water pumps and others in the Middle East resorted to windmills with woven-reed blades to grind grain. These technologies later found their way to Europe through merchants and crusaders. The idea of wind to generate electricity became prominent during the oil shortage of the 1970s, as countries searched for alternative sources of energy. This led the U.S. government to support research and development of large wind turbines, leading to several installations in California by the early 1980s.
Today, wind energy is expected to play an important role in the transition to Net Zero emissions by 2050. The expansion of onshore wind capacity and generation is likely to grow, while offshore wind holds the potential for an even more substantial role in the future. To realize this potential, significant investments must be swiftly mobilized, and technologies must rapidly develop cost-effective solutions to facilitate extensive offshore deployment.
Policy makers play a crucial role in offering long-term incentives to support necessary investments, establishing supportive market structures, and coordinating global efforts to ensure robust supply chains and trade of wind turbines, components, and raw materials.
The objective of this research is to study the wind energy sector as a major green energy source, investigating its growth opportunities and challenges. This research will serve as a second in a series of articles that will study the various top “green” energy sources and their emerging markets.
Executive Summary:
- Rapid Growth and Potential of Wind Energy: Wind power generation has experienced significant growth over the past three decades, with global wind electricity generation increasing 60-fold since 2000. Wind energy is identified as a critical component in achieving Net Zero emissions by 2050, highlighting the urgent need for significant investments and technological advancements, particularly in offshore wind capacity and generation.
- Major Challenges Facing Wind Energy Deployment: Major obstacles to wider adoption of wind energy include its intermittency, the impact on grid stability, the need for advanced weather forecasting, the requirement for flexible backup generation, and the critical need for investment in energy storage technologies. Addressing these challenges requires comprehensive strategies that include policy support, technological innovation, and infrastructure development.
- Investment and Policy Recommendations for Wind Energy: Robust policy support, including long-term incentives and market structures conducive to investment, along with international coordination to ensure supply chain resilience, are vital for realizing wind energy’s full potential. The significance of initiatives like the Inflation Reduction Act in the U.S. demonstrates the critical role of government policies in stimulating renewable energy growth, emphasizing the necessity of facilitating the sector’s expansion and integration into the energy grid.
Major Wind Energy Challenges
Let’s not sugar coat this energy source and address its problems head-on.
1. Intermittency and Unpredictability
Wind energy production is highly dependent on weather conditions, which are inherently variable and unpredictable. Unlike conventional power plants that can adjust output according to demand, wind farms generate electricity only when wind conditions are favorable. This intermittency can lead to periods of low or no power generation, posing challenges for electricity grid operators who must balance supply and demand in real time. This is usually at the worst possible times during hot summer months when the wind stops blowing after sunset during peak demand for air conditioning in homes.
2. Impact on Grid Stability and Reliability
The electricity grid requires a constant balance between supply and demand to maintain stability and prevent blackouts. The variability of wind energy can cause rapid fluctuations in power supply, making it more difficult to maintain this balance. Grid operators must have strategies in place, such as demand response programs or quick-start backup generation, to compensate for sudden drops or surges in wind power. As well, there needs to be permitting reform to get power from where the wind is blowing to where it’s needed.
3. Need for Advanced Weather Forecasting and Predictive Technologies
Accurate forecasting of wind patterns and speeds is critical for optimizing the use of wind energy and integrating it into the power grid efficiently. Advances in weather prediction technologies and algorithms for forecasting wind energy production are essential but remain a challenge. Improved forecasting can reduce the uncertainty and allow for better planning and utilization of backup generation resources.
4. Requirement for Flexible Backup Generation and Grid Management Solutions
To manage the variability of wind energy, grids require flexible backup generation options that can be ramped up and down quickly, such as natural gas peaker plants or hydroelectric power, which can compensate for sudden changes in wind energy production. This necessitates investment in additional infrastructure and technology to provide the required grid flexibility and responsiveness, adding to the overall cost and complexity of integrating wind energy.
5. Investment in Energy Storage Technologies
Energy storage systems, such as batteries, pumped hydro storage, or compressed air energy storage, can play a crucial role in mitigating the impact of wind energy’s variability. By storing excess energy generated during periods of high wind and releasing it during periods of low wind, energy storage solutions can help smooth out the supply of wind power. However, the cost and efficiency of current energy storage technologies remain major challenges for widespread adoption.
Wind Energy: How it Works and Production Technology
The process of wind energy generation depends on turbines to utilize the wind’s kinetic energy and convert it into electrical energy. The larger the wind turbines and stronger the wind, the greater and more efficient the energy produced. Accordingly, wind turbines are huge structures with large rotating blades that can be over 100 feet long, attached to huge towers that can reach heights as tall as a 20-storey building. These turbines are commonly clustered together in wind farms, where numerous turbines are strategically positioned in areas abundant with strong and consistent wind patterns to maximize energy production.
There are two main types of wind turbines: horizontal-axis and vertical-axis. Horizontal-axis turbines, also known as upwind turbines, are the most common type. They function similarly to propeller airplane engines. A typical upwind turbine must face the direction of the wind to operate effectively. It consists of several main components, as shown in Figure 1:
- Steel or concrete wind tower: which provides length to enable the turbine to capture more kinetic wind energy by reaching stronger and faster wind.
- Rotor: holding two to three blades, which lift and rotate with the wind blows to capture the force of the wind and convert it into mechanical rotational energy. The length and shape of the blades are crucial factors influencing the efficiency of the turbine.
- Shafts and gearbox: when the blades rotate, they turn a low-speed shaft at about 30-60 rotations per minute (rpm). This low-speed shaft is connected by a gearbox to a high-speed shaft, to multiply the rotational speed to an adequate level to produce electricity (1,000-1,800 rpm).
- Generator: this then converts the mechanical rotational energy into electrical energy, producing AC electrical current.
- Nacelle: which sits above the tower, housing the gearbox, low- and high-speed shafts, and generator.
- Power cables: which transport the electricity to the ground.
- Tower foundation: which provides stability and support to the entire turbine structure, often requiring deep anchoring into the ground to withstand the forces exerted by the rotating blades.
Figure 1 – Key Components of a Horizontal-Axis Wind Turbine
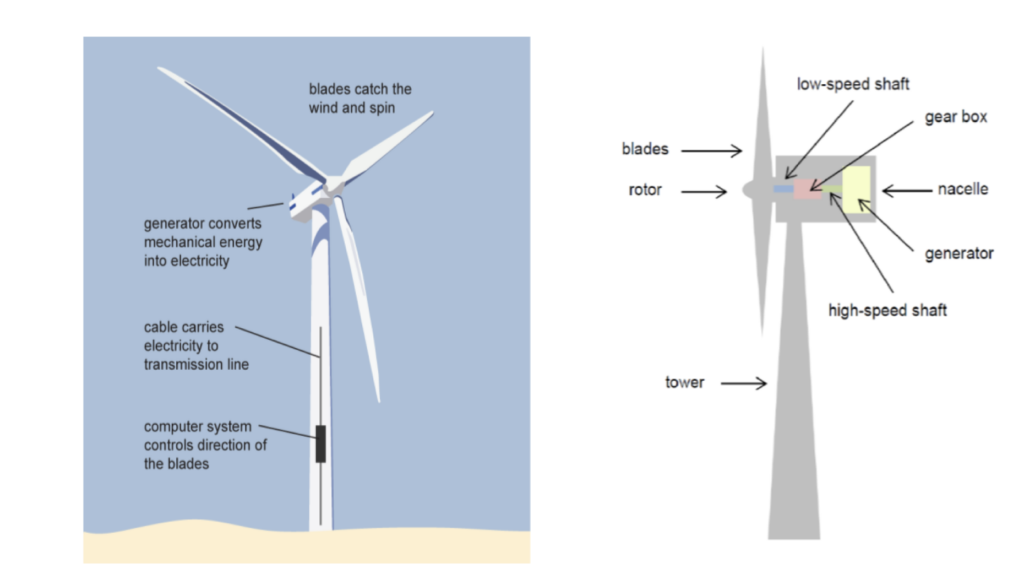
Source: U.S. Energy Information Association and Lexology.
Wind turbines vary in their size and generating capacity. In general, the taller the turbines and longer the blades, the more the electricity generated. For example, small wind turbines may have an electric-generating capacity of 10kW, suitable to power a single home. On the other hand, the largest existing turbines can reach electric-generating capacities of close to 15MW (equivalent to 15,000 kW). As production technology continues to advance and efficiency needs increase, larger wind turbines are continuously entering into development. Advancements in turbine design and manufacturing processes have led to the development of more efficient and powerful turbines.
Two types of wind energy production currently exist: onshore and offshore wind:
- Onshore wind energy: this is the energy produced by wind turbines that are located on land, usually located in areas where strong wind speeds are predominant, often in more rural areas or wide fields where fewer buildings or obstacles can interrupt the wind. Onshore wind technology has the advantage of being much more cost-effective than its counterpart, offshore wind, requiring cheaper installation, infrastructure, and maintenance costs. This cost-effectiveness positions onshore wind farms as substantial contributors to the renewable energy landscape, thanks to their accessibility and affordability. Their limitation is simple: space. There’s only so much land available and there is strong NIMBY towards new installations.
- Offshore wind energy: in this case, power is generated by harnessing the strong force of wind in the high seas. While onshore wind turbines are generally more efficient, their offshore counterparts benefit from stronger and more consistent sea winds, with fewer obstructions hindering airflow. However, constructing offshore turbines is considerably more expensive, requiring complex infrastructure and posing maintenance challenges. Despite these initial hurdles, offshore wind energy holds great promise for sustainable electricity generation, especially in regions with limited land availability and high energy demand. Biggest limitation is cost and some NIMBY where the platforms can be seen from the shore.
The Rapid Growth of Wind Energy Capacity and Generation
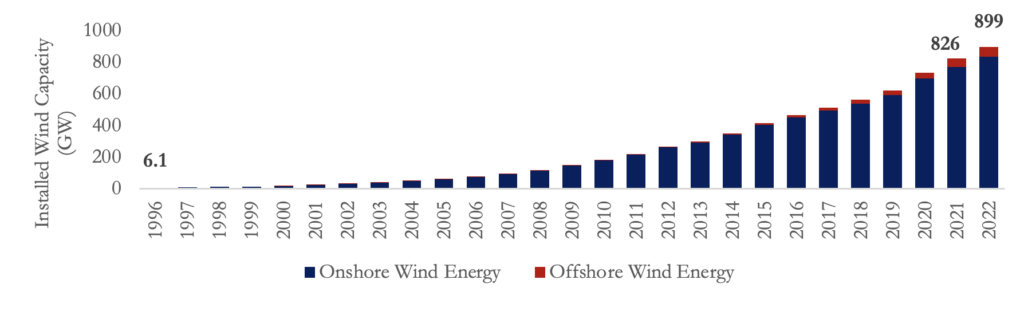
According to the International Renewable Energy Agency (IRENA), global installed wind generation capacity has increased by a factor of almost 150, from a mere 6.1 GW in 1996 to 899 GW by 2022. This represents a cumulative annual growth rate of around 21%, most of which has been the result of scaling up onshore wind energy capacity. In 2022, onshore wind capacity stood at 836 GW, or 93% of the total, while offshore capacity accounted for no more than 7%. Nevertheless, offshore capacity has rapidly picked up over the past two decades. While it was virtually non-existent in the 1990s, cumulative offshore wind deployment increased by more than 120-fold since the early 2000s (from a capacity of less than 1 GW) and 20-fold since 2010 (from a capacity of 3 GW) to reach 63 GW of capacity in 2022 (Figure 2). The substantial growth in wind energy capacity highlights its increasing importance as a renewable energy source, contributing significantly to global efforts towards sustainable energy.
Figure 2 – The Growth in Total Installed Wind Energy Capacity, 1996-2022
As wind power capacity picked up, so has the volume of wind electricity generation. Global wind energy generation has grown by almost 60 times since 2000, jumping from 31 TWh to 1,839 TWh in 2022, of which 1,701 TWh was from onshore wind technologies, while only 138 TWh were generated offshore (Figure 3).
Figure 3 – The Growth in Total Wind Energy Generation, 2000-2022
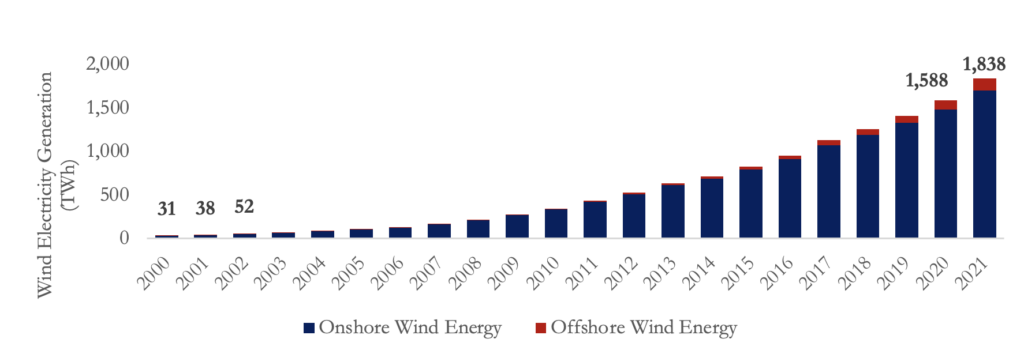
Source: International Renewable Energy Agency.
Not only has wind energy generation rapidly grown over the years, but it has also gained remarkable importance in the total renewable energy mix. Figure 4 shows the total volume of renewable electricity generation since 1990. While the role of wind was virtually non-existent back then, it grew in significance to present 25% of the total renewable electricity mix by 2021, only surpassed by hydropower.
Figure 4 – Renewable Energy Generation by Technology, 1990-2021, %
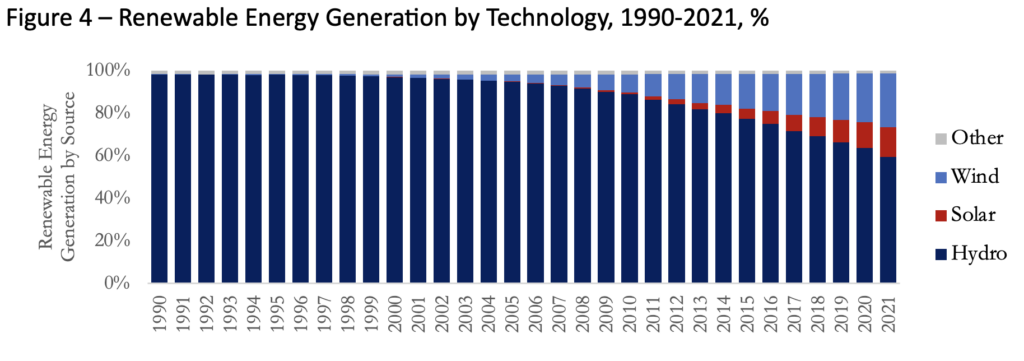
Source: International Renewable Energy Agency.:
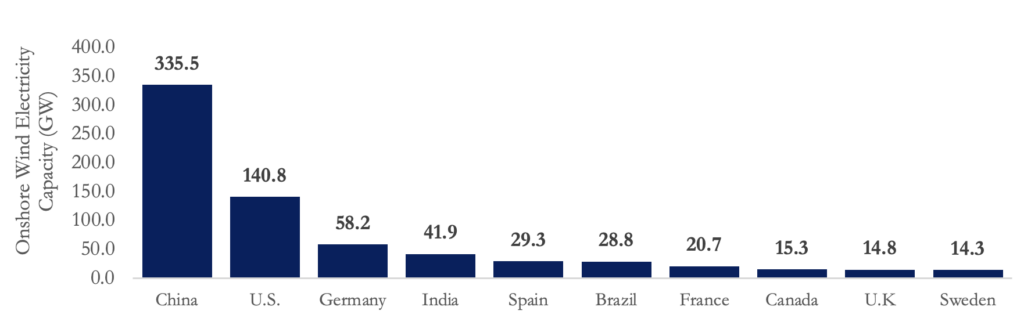
At the regional level, China dominates onshore wind energy capacity, as it accounted for almost half of total global capacity (over 330 GW)) in 2022. The U.S. comes second, holding around 140 GW of onshore wind capacity (20%), followed by Germany, India, Spain, Brazil, and France, which together account for a quarter of global capacity (Figure 5). The regional distribution of onshore wind capacity reflects varying national priorities and policy frameworks/regulations/subsidies in promoting renewable energy development.
Figure 5 – Top 10 Countries with Onshore Wind Electricity Capacity
Source: International Renewable Energy Agency.
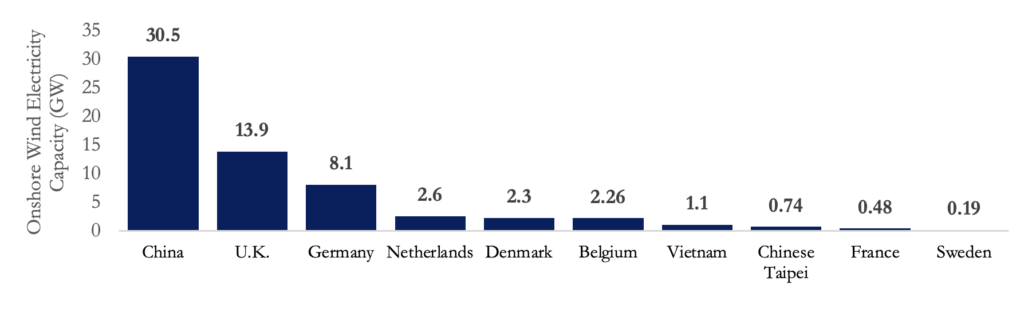
The picture is different, however, when it comes to offshore wind. Although China also leads the scene, with over 30 GW or 50% of global offshore capacity, the role of the U.S. is virtually non-existent. Europe is also a major player in the offshore wind market, with the U.K. holding the highest electricity capacity of 14 GW (22%). Germany, the Netherlands, Denmark, and Belgium follow, holding together 25% of global offshore capacity (Figure 6).
Figure 6 – Top 10 Countries with Offshore Wind Electricity Capacity
Source: International Renewable Energy Agency.
The Main Applications of Wind Energy
Utility-Scale Wind Energy
Wind energy is used in a variety of applications, ranging from utility-scale electricity generation to smaller-scale distributed applications. The former is the most common application of wind energy, where large onshore or offshore wind turbines are used for utility-scale power generation. Utility-scale wind facilities are defined by the U.S. Energy Department as those with at least 1 megawatt (MW) of electricity generation capacity. Wind turbines are usually installed within large multi-turbine wind farms that are connected to the national electricity grid, through which it is then transmitted to multiple users across the nation. Given their large scale of production, such wind projects have the advantage of being efficient and cost-effective, producing electricity that can be highly competitive with other power generation sources. Utility-scale wind energy plays a vital role in fulfilling the energy needs of both large populations and industries, making a significant contribution to the overall stability of the electricity grid.
Distributed Wind Energy
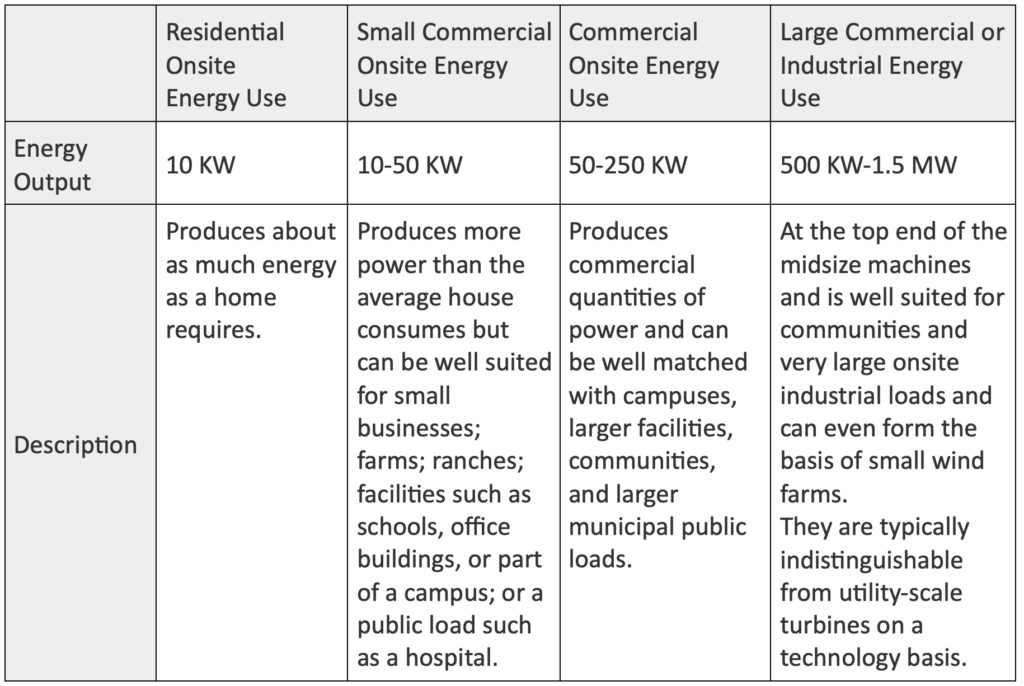
Other than utility-scale applications, wind turbines are often used as distributed applications, which can range from the use of a single small private turbine to power a building, to larger-scale projects or wind farms to generate electricity for communities or large facilities. Users can include, for example, homes, businesses, farms, schools, municipal utilities, tribes, or remote communities. Distributed wind turbines can either fully provide the needed power at a given location or complement the grid-provided electricity as part of a hybrid system.
While some community wind projects may have a large scale with multiple wind turbines connected to a single grid, they should not be confused with utility-scale projects. Unlike the latter, in distributed projects, the local community is the main recipient of the generated energy, through the private/local rather than the main national grid. Although in some cases communities or individuals might choose to connect to the main grid to sell their surplus power, in distributed wind projects most of the benefits remain within the local community. In many cases, such wind projects might even remain fully off-grid. The versatility of distributed wind energy enables localized power generation, addressing the specific energy requirements of various communities and facilities, thereby fostering energy independence and resilience. The table below summarizes the types of distributed wind turbines and applications.
Figure 7 – Types of Distributes Wind Turbines and Applications
Source: Wind Exchange, U.S. Department of Energy.
The Economics and Cost Competitiveness of Onshore Wind
The Fall in the Levelized Cost of Energy
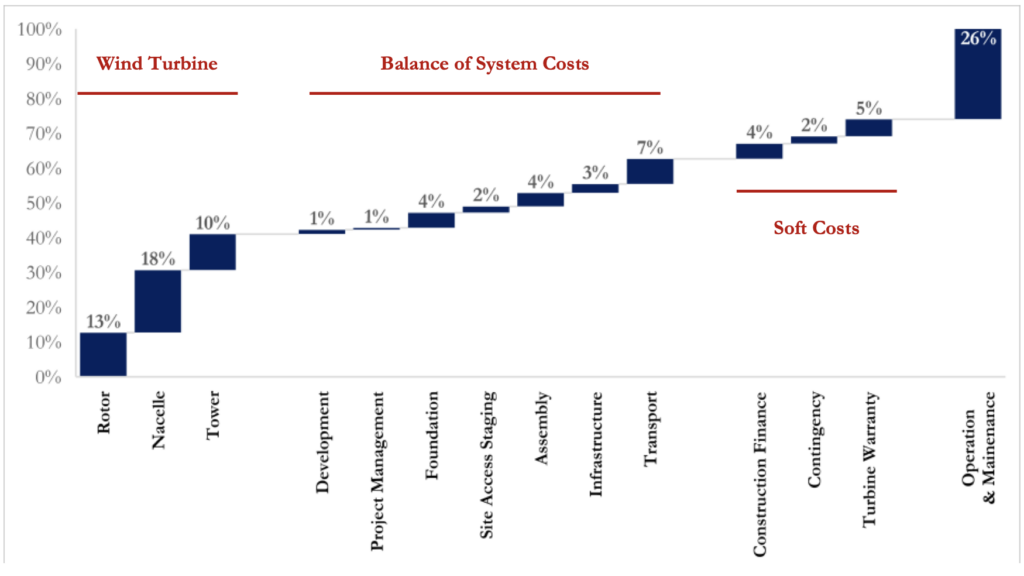
The cost of renewable energy technologies is usually measured by their Levelized Cost of Energy (LCOE), which captures the present value of the total cost of building and operating the project, per unit of total electricity generated, over its lifetime. For a wind energy project, the LCOE is determined by the total installed costs (including wind turbine, installation costs, and other balance of system costs), the lifetime capacity factor, operation and maintenance costs, the economic lifetime of the project, and the cost of capital or financing. The price of wind turbines is typically the largest cost component in onshore wind farms, accounting for over 40% of the total LCOE. Other balance of system costs, such as engineering, development, project management, electrical infrastructure, transport, and installation contribute close to 20% of the cost, while operational and maintenance costs account for around 10-30% of most projects. Other soft costs, such as construction finance, warranties, and contingencies (e.g., insurance, permitting, bonding, and markup estimates) capture the remaining cost components of around 10% (Figure 8).
Figure 8 – LCOE Breakdown for a Utility-Scale Onshore Wind Plant (2022 $/MWh)
Source: National Renewable Energy Laboratory, U.S. Department of Energy, 2022.
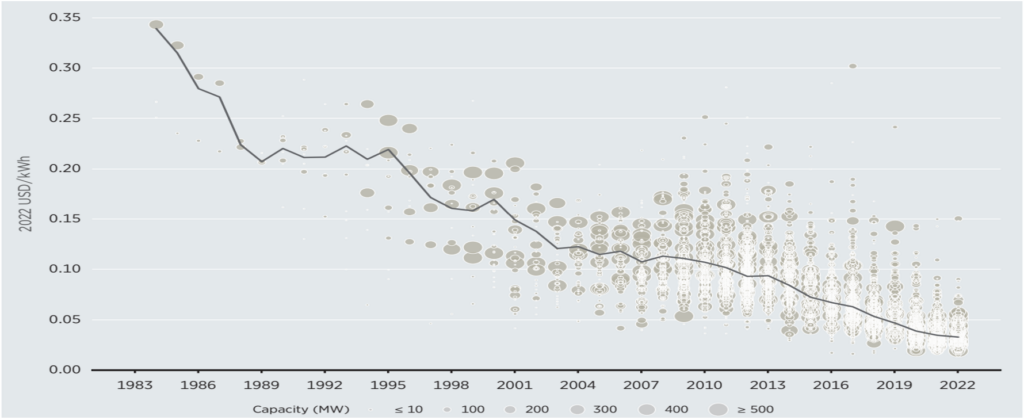
As shown in Figure 9, below over the past four decades, the global weighted average LCOE of onshore wind projects fell by around 90% from $0.339/kWh in 1984 to $0.033/kWh in 2022. This rapid improvement in cost competitiveness has placed onshore wind energy ahead of utility-scale solar PV (global weighted average LCOE of $0.049 in 2022), making it the most competitive renewable energy generation technology without financial support.
Figure 9 – LCOE of Onshore Wind Projects and Global Weighted Average, 1984-2022
Source: International Renewable Energy Agency, 2022.
According to IRENA, in 2022, most major economies (excluding Japan) had weighted average LCOEs of commissioned onshore wind projects between $0.024 and $0.055/kWh, well below the $0.069/kWh lower range for fossil fuel-fired power generation. Moreover, almost 87% of the new global onshore utility-scale projects commissioned in 2022, equivalent to 59 GW, had lower LCOE than the weighted average cost of new fossil fuel-fired power generation.
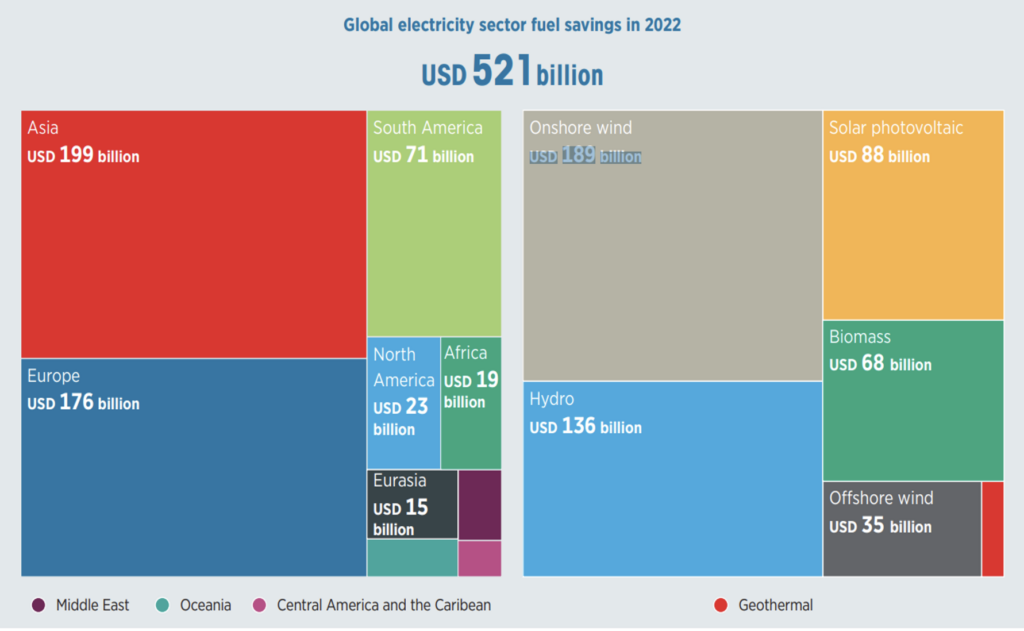
The economic benefits and cost competitiveness of onshore wind energy technologies were particularly evident in the wake of the 2021-2022 fossil fuel price crisis. It is estimated that the globally deployed renewable energy since 2000 saved the electricity sector around $521 billion in fuel costs in 2022, despite the relative rise in the cost of wind turbines (Figure 10). The biggest chunk of fuel cost savings was the result of onshore wind energy deployment (36%; $189 billion), mostly in Asia (38%; $199 billion) and Europe (34%; $176 billion). These figures further highlight the economic resilience and sustainability of wind energy in mitigating energy-related financial risks and enhancing energy security.
Figure 10 – Electricity Sector Fossil Fuel Savings from Renewables Deployment Since 2020
Source: International Renewable Energy Agency, 2022.
This impressive reduction in the LCOE of onshore utility-scale wind energy has been driven by several factors, including the drop in total installed costs of wind farms, improvement in turbine technologies, rise in capacity factors, reduction in operation and maintenance costs, as well as economies of scale and more competitive procurement.
The Decline in the Total Installed Costs
Over the past four decades, the global weighted average total installed cost of onshore wind projects dropped by more than three quarters, from $5,496/kW in 1984 to $1,274/kW in 2022. This fall was paralleled by massive wind energy deployment, as the average installed costs dropped by close to 9% for every doubling in cumulative onshore wind capacity deployed globally. The decline in the total installed cost was mostly driven by the rapid drop in wind turbine prices, in addition to a reduction in the balance-of-plant cost. The substantial decrease in total installed costs reflects the efficiency gains and economies of scale achieved in the wind energy sector, contributing to its overall cost competitiveness.
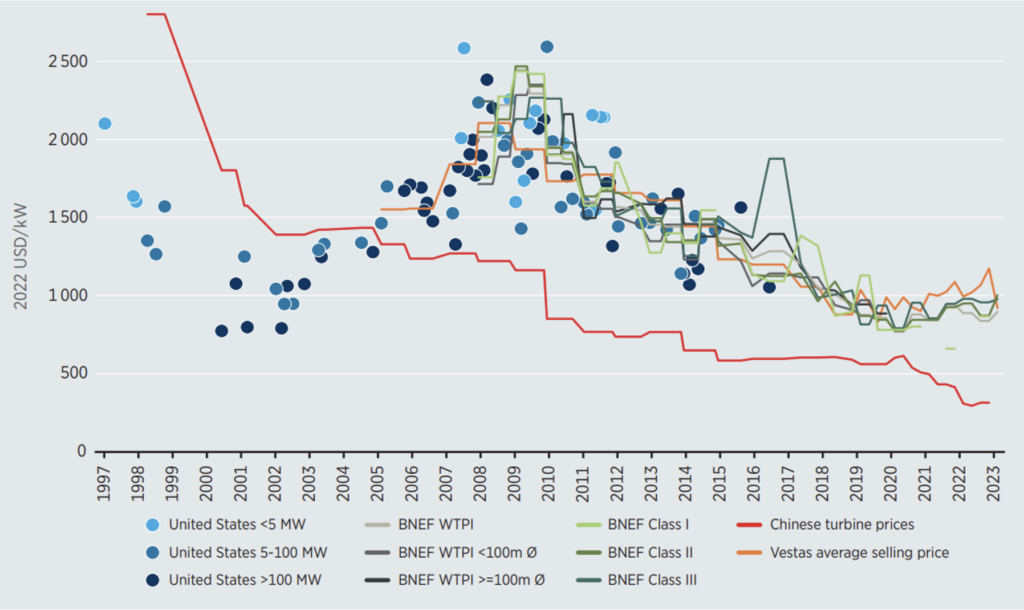
As manufacturing capacity grew, supply chains became deeper, competition increased, and price margins shrank, average global prices of wind turbines rapidly declined by around 49-64% (excluding China) between 2009 and 2022. In China, the drop was even more dramatic, as prices steadily fell by almost 90% since 1998. In 2022, wind turbine prices stood at 310/kW in China and between USD 840/kW and USD 1175/kW in the rest of the world, which was a little bit above the 2020 lows due to the COVID-induced supply chain constraints (Figure 11).
Figure 11 – Wind Turbine Price Indices and Price Trends, 1997-2023
Source: International Renewable Energy Agency, 2022.
The Improvement in Wind Turbine Technology and Capacity Factors
Although the cost of wind turbines has remarkably declined, their performance has been on the rise, thanks to an increasing trend towards more efficient and advanced turbine technologies. This has led to the use of larger turbine sizes, with larger rotor diameters and hub heights, larger swept areas, and more optimized turbine ratings. Moreover, more advanced technologies have made it common practice to optimize site configuration to better exploit wind resources and reduce output losses. All those factors have resulted in enhanced energy yield and lower operation and maintenance costs per unit of capacity, hence better project viability and cost competitiveness. The improved capacity factors of wind projects have particularly been a major driving force behind the rapid deployment and increase in wind energy capacity and generation. Between 1984 and 2022, the global weighted average capacity factor for onshore wind almost doubled from 19% to 37%.
Economies of Scale, Lower Operation and Maintenance Costs, and Competitive Procurement
The economies of scale provided by the increasing deployment of large wind energy projects have also contributed to cost reductions. Firstly, production benefits from larger volumes and regional manufacturing hubs, which lower labor costs and unit overheads. Secondly, these large projects help spread out the costs of development, operation, and maintenance. Additionally, the adoption of advanced digital technologies and data analytics has significantly reduced operation and maintenance expenses. This is achieved by enabling autonomous inspections and predictive maintenance using performance data from turbines. Shifting from traditional feed-in-tariff schemes to competitive auctions for procurement has further reduced costs across the supply chain. The combination of advanced digital technologies and innovative procurement approaches has improved cost-effectiveness and competitiveness in the wind energy sector, facilitating the development of sustainable and scalable renewable energy solutions.
The Economics of Offshore Wind Energy
Although offshore wind energy technologies have matured rapidly since 2010, they remain the least cost-competitive renewable alternative to the use of fossil fuels. The relative difficulty of installation, operation, and maintenance of offshore projects in harsh high sea environments add to the costs of their planning, development, infrastructure, construction, operation, and maintenance. Investment costs are especially higher in deeper waters, requiring the costly deployment of floating rather than fixed-bottom platforms, and where turbines are located farther from the shore (to harvest stronger wind). Despite the initial higher costs, offshore wind projects offer advantages such as larger economies and higher capacity factors, leveraging stronger wind resources compared to onshore projects.
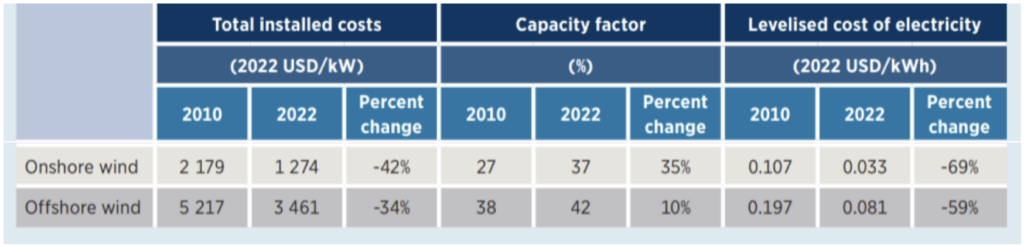
Offshore wind projects, however, have the advantage of larger economies and higher capacity factors, as they can harness stronger wind resources compared to onshore projects. The utilization of larger wind turbines, higher hub heights, and longer blades, has significantly contributed to enhancing the global weighted average capacity factor of newly commissioned offshore wind farms which grew from 38% in 2010 to 42% in 2022, surpassing the 37% for onshore projects (Figure 12).
Figure 12 – Costs and Capacity Factors for Onshore and Offshore Wind, 2010 & 2022
Source: International Renewable Energy Agency, 2022.
Despite initial challenges, the pipeline of competitive offshore wind projects has been expanding in recent years, thanks to the advances in wind turbine technology, increasing competition, and the development of deeper local and regional supply chains. Over the last decade, the global weighted average LCOE of offshore wind projects has dropped by almost 60%, from $0.197/kWh in 2010 to $0.081/kWh in 2022 (Figure 13).
Figure 13 – LCOE of Offshore Wind Projects and Global Weighted Average, 2000-2022
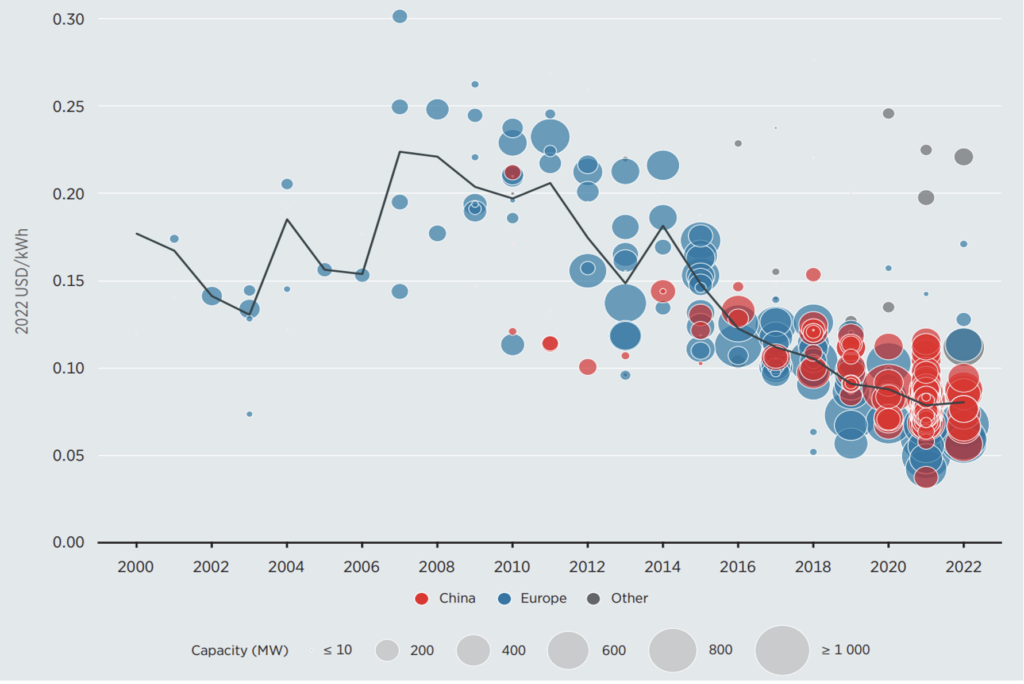
Source: International Renewable Energy Agency, 2022.
When it comes to total installation costs, the trend has been far from linear. The increasing movement towards projects that are more advanced, farther from shore, and in deeper waters has initially pushed up the global weighted average total installed cost, which hovered around $5500/kW from 2008 to 2015. However, the cost rapidly trended downwards to reach around $3,461/kW in 2022. Cost reductions have been supported by the increasing maturity and competition in the offshore industry, which led to the standardization of wind turbine and foundation designs, more sophisticated and faster installations, and the manufacturing of offshore wind components in regional hubs. Moreover, the increasing trend towards the use of higher capacity turbines with longer blades, larger rotor diameters, and higher hub-heights, has contributed to the reduction in LCOEs by increasing energy capture. In addition, the installation of specialized ships and digitization of the energy sector have contributed to cost savings through relying on the turbine performance data for predictive maintenance and preventive measures, allowing interventions before costly failures occur and lowering operation and maintenance costs.
While the U.K and Germany have been experimenting with more distant offshore wind projects, those in other European countries such as Denmark, Belgium, and the Netherlands tend to be closer to shore. When it comes to cost competitiveness. Denmark has the lowest average LCOE for newly commissioned offshore wind projects, which stood at around $0.043/kWh in 2021. Denmark’s LCOE is partially driven by its experience, given it was the first country to pioneer offshore wind projects at a commercial scale, in addition to its relatively close-to-shore and shallower projects. The Netherlands and the U.K. are also among the countries with the lowest weighted average LCOE for newly commissioned offshore wind projects, standing at around 0.058/kWh and 0.064/kWh in 2022, respectively. In Asia, China stands out as the country with the lowest weighted average LCOE at $0.077/kWh in 2022. These regional variations in LCOE highlight the influence of factors such as experience, project location, and technological advancements on the cost competitiveness of offshore wind projects.
Wind Energy Potential & Transition to Net Zero
Besides solar energy, wind represents a major source of power generation in the transition to Net Zero Emissions (NZE) by 2050, yet annual additions in wind capacity need to significantly accelerate by 2030 to be on track to a 2050 NZE Scenario.
Under existing policies and market conditions, global wind capacity is projected by the International Energy Agency (IEA) to grow by 91% between 2022 and 2028, to reach around 1,715 GW. This, however, would fall short of reaching the required 2030 capacity to be on track to an NZE scenario by 2050, which necessitates a tripling in renewable capacity by 2030, facilitated by an equivalent tripling in wind energy capacity. If government policies were to support further deployment as needed, under an accelerated scenario, wind energy capacity would reach around 1,930 GW by 2028, envisioning an additional 24% growth over the current path, to accelerate further by 40% to 2,742 GW by 2030 (Figure 14). This accelerated growth trajectory emphasizes the urgent need for proactive policies and investments to meet the ambitious targets of the NZE scenario.
Figure 14 – Installed Wind Capacity Outlook and the NZE Scenario
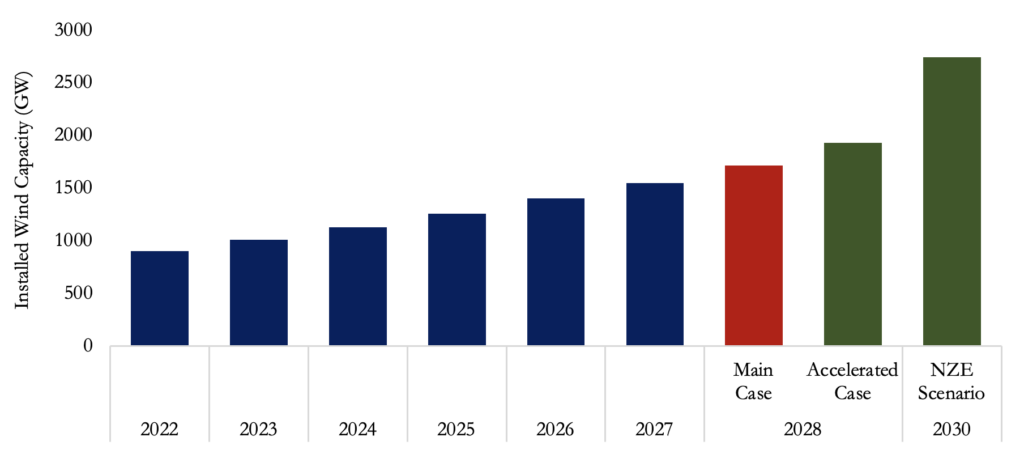
Source: International Energy Agency.
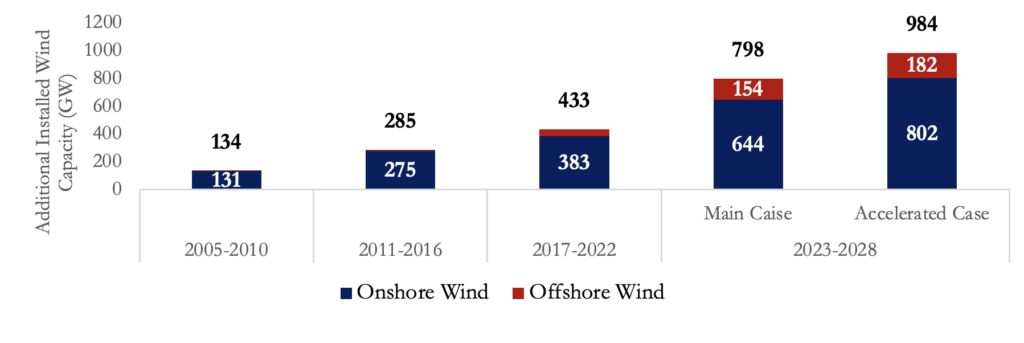
The path to the NZE Scenarios would require increased deployment of both onshore, as well as offshore wind farms. Between 2023 and 2028, wind capacity additions are forecast to reach around 800 GW under the existing policies and market conditions and 1000 GW under an accelerated scenario. Onshore wind installations are projected to account for most capacity additions, with offshore wind representing 20% of additional deployments. Under an accelerated scenario on track to NZE by 2050, onshore additions are projected to double to 802 GW, while offshore additions will more than triple by 182 GW over the five years leading up to 2028, compared to 383 GW and 51 GW capacity additions over 2017-2022, respectively (Figure 15).
Figure 15 – Additional Onshore and Offshore Installed Wind Capacity Outlook
Challenges Hindering the Rapid Deployment of Wind Energy
Will the Current Macroeconomic Challenges Undermine Wind’s Potential?
The current macroeconomic conditions have created multiple cost headwinds in the face of rapid wind deployment, particularly offshore wind. Outside of China, especially in Europe and North America, the persisting supply chain disruptions, higher inflation, higher interest rates and hence cost of capital, and longer timelines for permits and grid connections are creating multiple challenges and increasing the costs for developers. The unfavorable macroeconomic conditions have hit offshore wind the hardest, as its investment costs have increased by over 20% amid the crisis.
Offshore wind has been hit the hardest by the new macroeconomic environment, with its expansion through 2028 revised down by 15% outside China. In 2023, more than 15 GW of offshore wind projects and investments worth over $30 billion have been put on hold amid the increasing cost environment. As shown in Figure 16, in 2022, the global weighted average total installed costs and LCOE of offshore wind energy projects increased to $3,461/kW and $0.081/kWh, respectively, reversing the downward trend since 2015.
The current economic challenges pose a significant threat to the scalability of wind energy projects, particularly offshore, potentially undermining progress towards sustainable energy goals.
Figure 16 – Onshore and Offshore Wind Costs, 2020-2022
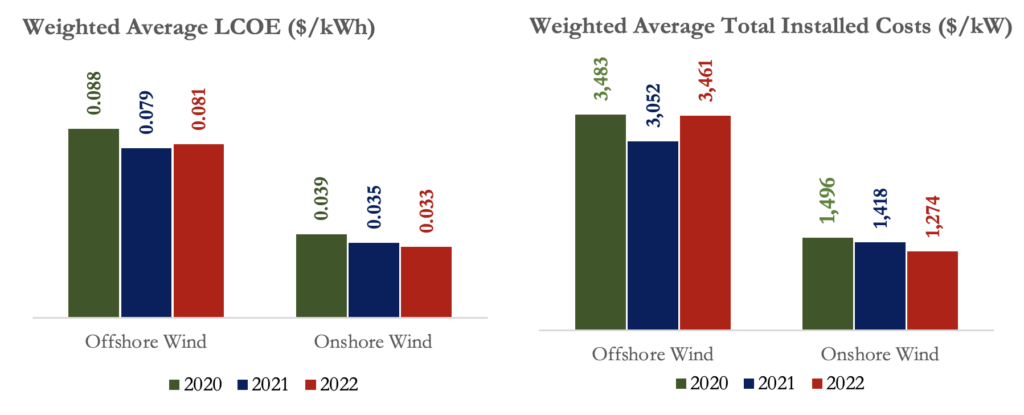
Source: International Renewable Energy Agency.
The key issue with such increasing costs is that several wind farm developers are tied by long-term contractual agreements, to sell electricity at low set prices. If costs continue to increase, agreed prices may become economically unviable.
For example, a long-planned 140-turbine offshore wind farm in the North Sea by the Swedish wind farm Vattenfall has become unfeasible, as the company estimates that construction costs have jumped by almost 40% under the recent developments. Moreover, British BP and Norwegian Equinor companies are worried that a joint project off the coast of New York, with a capacity to power 2 million households, could only succeed in attracting the necessary financing if power price agreements were renegotiated.
The Conundrum of Ever Larger Wind Turbines
It is without doubt that the trend towards more efficient and higher wind turbines with larger rotor blades, that could harvest more energy from the same wind resources, has been a major driving force behind the reduction of wind energy production costs over the past decade (estimated to have contributed 60% in cost savings). Nevertheless, the complicated structures of the new wind turbines have created specific infrastructure, transport, and installation challenges and needs.
As wind turbines increase in size, there is a risk that investing in new vehicles capable of transporting them may quickly become obsolete. Moreover, infrastructure challenges that would require transformational investments stand in the way. For example, the huge wind turbines require larger ports, and reinforced harbors to withstand the massive weight, in addition to other logistical obstacles.
Indeed, hub heights for utility-scale onshore wind turbines have almost tripled from 98 ft in 1990 to around 300 ft in 2020 and 322 ft in 2022, taller than the Statue of Liberty. Offshore wind turbines even stand taller with heights at 330 feet in 2016 that are expected to reach almost 500 ft by 2035. Rotor diameters have also rapidly grown, exceeding 400 ft for onshore and 500 ft for offshore turbines (longer than a soccer field), with the latter forecast to almost double to more than 800 ft by 2035. These challenges highlight the need for innovative solutions and significant investments in infrastructure to support the deployment of larger wind turbines.
Supply Chain Challenges
Over the past decade, China has become the world’s leading manufacturer of wind turbines, key components, and raw materials. China is by far the world’s dominant turbine nacelle manufacturing hub. There are currently 153 global wind turbine assembly plants in operation, of which more than 100 (two-thirds) are in China, almost 20 (14%) are in Europe, 13 are in India (8%), while only a few are in the U.S. and other countries. When it comes to offshore wind, China alone accounts for 70% of the nacelle assembly facilities, with Europe and Asia Pacific region accounting for the rest. Moreover, a total of 74 nacelle assembly facilities have been planned or are under construction, 64 of which are in China.
In energy terms, the global turbine nacelle assembly capacity stood at around 163 GW in 2023. China alone accounted for 98 GW, capturing a 60% market share, followed by Europe at 19%. The U.S., India, and Latin America each accounted for less than 10%. China’s dominance and uneven distribution of wind turbine nacelle assembly create several supply chain challenges, with several demand and supply imbalances.
For onshore wind, China accounts for 82 GW of annual capacity, followed by Europe (21.6 GW), the U.S. (13.6 GW), India (11.5 GW), and Latin America (6.2 GW). Comparing this production capacity to onshore wind demand up to 2030, however, reveals several shortages. While China, India, and Latin America will face no problems to accommodate their demand for onshore wind generation by the end of the decade, Europe and the U.S. are expected to fall short of the needed capacity in 2026 (Figure 16)
In a business-as-usual scenario, this will necessitate the reliance on imported wind turbines to meet the growth in demand. Supply chain challenges will particularly be binding if regional localization initiatives in the U.S. and Europe disrupt the free trade of wind turbines and components, without rapidly building the necessary capacity to compensate for the shortage.
Figure 16 – The Demand and Supply of Onshore Wind Capacity
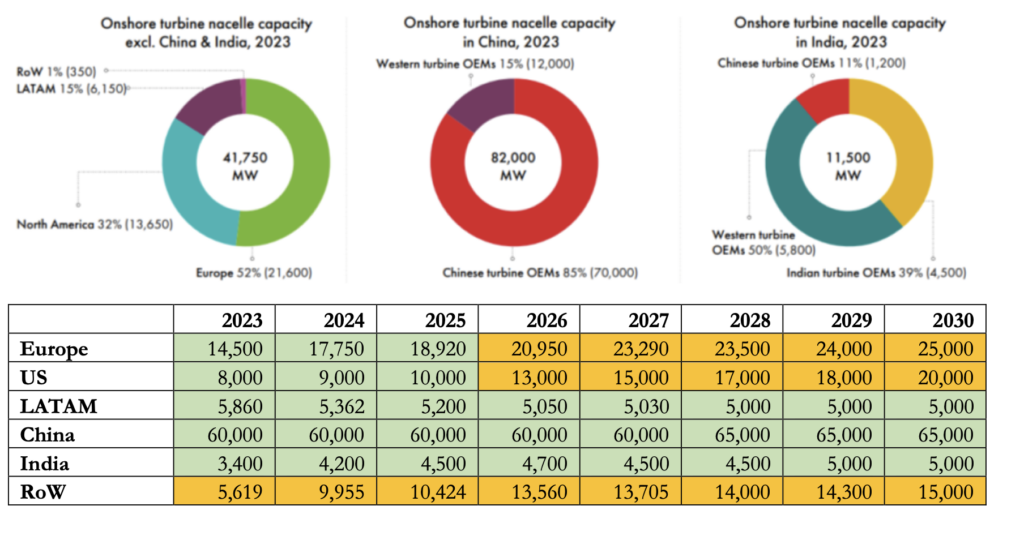
Source: Global Wind Energy Council.
The situation is even starker when looking at offshore wind. Virtually all wind installation capacity is concentrated in China, Europe, and the rest of Asia Pacific, with the U.S. and the rest of the world holding no market share. Accordingly, potential demand-supply bottlenecks are expected to hit North America earlier in 2025, while hitting Europe, Latin America, and other Asian countries between 2026 and 2029 (Figure 17).
Figure 17 – The Demand and Supply of Offshore Wind Capacity
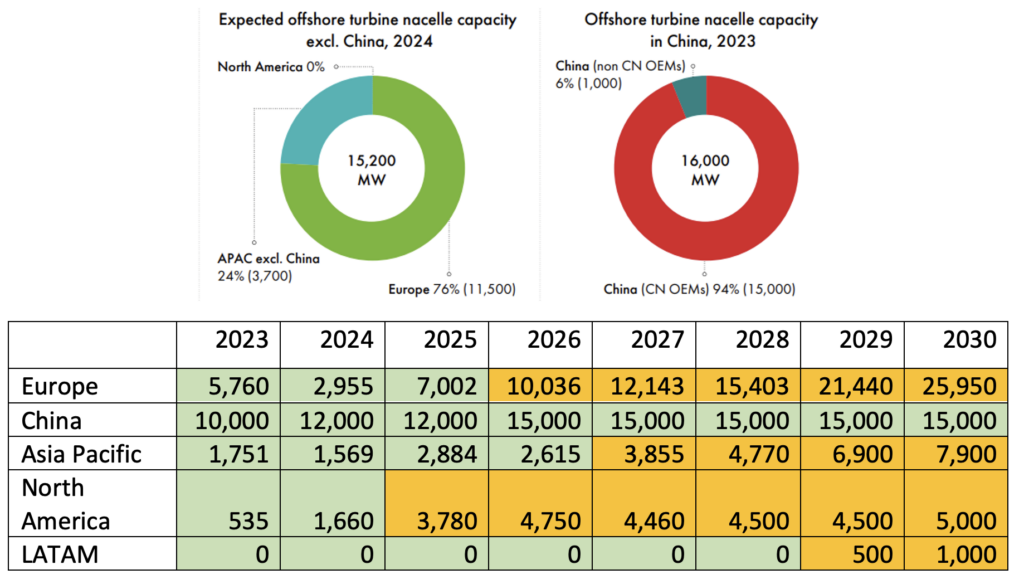
Source: Global Wind Energy Council.
Global Investment Trends in Wind Energy
Global investments in wind energy technologies more than doubled since 2013, reaching a record high of $174.5 billion in 2022. Most investment flows went towards onshore wind generation, which doubled from $64.9 billion in 2013 to $140.7 billion in 2022. Nevertheless, while offshore wind projects accounted for no more than a fifth of total wind investments in 2022, they saw the largest increase in investment flows increasing five-fold during this period, from only $7.1 billion in 2013 to $33.8 billion in 2022 (Figure 18). This substantial increase in investment reflects the growing recognition of wind energy as a crucial component in the global transition to renewable energy sources, driven by its significant potential to mitigate climate change.
Figure 18 – Global Wind Energy Investments, 2013-2022
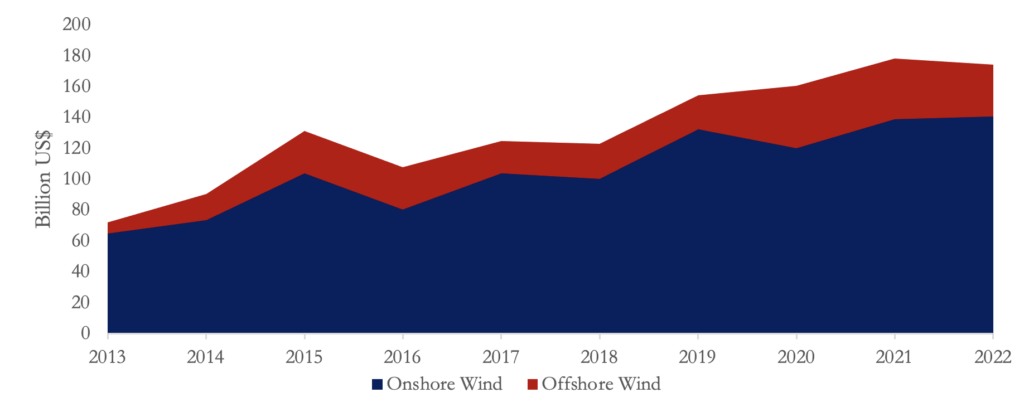
Source: International Renewable Energy Agency.
Over the past decade, wind energy attracted a major share of investment in renewables, in the range of 30-47%, while the remaining proportion mostly flew towards Solar. In the four years leading up to 2022, however, the share of wind investments slightly dropped as Solar rapidly took over. The former stood at 35% of total renewables investments in 2022, comprising 28% of onshore wind and 7% of offshore wind (Figure 19).
Figure 19 – Global Renewable Energy Investments by Technology, 2022, %
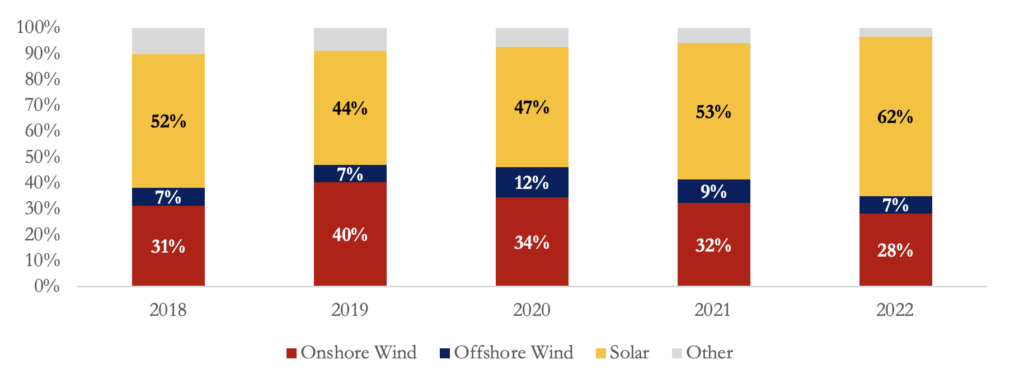
Source: International Renewable Energy Agency.
Despite the rapid increase in investments, wind energy deployment remains insufficient to achieve the Net Zero targets by 2050. According to IRENA, annual renewable energy investment needs to at least quadruple to remain on track to achieve the 1.5°C Scenario.
IRA Turbocharges U.S. Wind Sector, Global Coordination Necessary
The Inflation Reduction Act (IRA) is the largest global investment in climate action, with a transformative capacity to supercharge renewable energy growth in the U.S. It has the potential to reshape and regionalize substantial segments of the global renewable energy supply chain. Certainly, supply chains have already started adapting since the issuance of the IRA. For example, the U.S. renewable energy industry has announced over $65 billion of capital investments in clean energy projects, adding over 30 GW of new capacity, and 32 new or expanded clean energy manufacturing facilities, including 6 (re)investments in new or existing wind power manufacturing facilities. According to the American Clean Power Association (ACP), the IRA is projected to deliver more than 550 GW of additional clean energy by 2030, which will generate more than 40% of the electricity needs, powering 160 million homes in the U.S.
Under the IRA, tax credits for investment and production in wind and solar will be extended until end-2024, after which a clean energy technology-neutral tax credit will be provided through 2032. Production credits will particularly reward locally supplied components. This support for domestic manufacturing is expected to promote the development of a local supply chain for onshore as well as offshore wind, as it incentivizes the establishment of new manufacturing, processing, component, and raw material plants. Indeed, the nation is already witnessing the reemergence of component manufacturing facilities that have been idle in recent years, in addition to equipment providers, such as GE and Siemens Gamesa, with intentions to build offshore wind nacelle manufacturing plants. The IRA represents a significant step towards accelerating renewable energy growth in the U.S., but global cooperation and alignment of policies are essential to ensure a smooth and efficient transition to sustainable energy worldwide.
Although the IRA has sparked global criticism, with the EU expressing “serious concerns” that it might breach the World Trade Organization’s (WTO) international trade governing rules, it has nevertheless sparked a wave of other regional ambitions worldwide. For example, the EU responded by enacting the Net Zero Industry Act, which aims to streamline regulations for clean energy investments. It also establishes mandatory non-price criteria to provide higher procurement prices for investments in EU-based supply chains. Additionally, the Critical Raw Materials Act was implemented, requiring that a minimum of 10% of raw materials be extracted and 40% be processed within the EU by 2030.
While such supply chain regionalization policies might be effective in boosting clean energy investments, governments should still approach them with caution. Supply chain challenges might intensify if such policies lead to major interruptions in the free flow of trade of wind turbines and their components.
The U.S. production of wind turbines and components is negligible compared to China, and even much lower than Europe. This is especially the case for offshore wind. The pace at which the U.S. or European supply chains can develop their supply chains, and when they would be able to meet the required growth in demand, is still uncertain. Uncoordinated government policies can indeed disrupt supply chains and hinder global wind energy growth. Accordingly, coordinated government efforts for the common goal of achieving an energy transition within the global objectives of the Paris Agreement are necessary to ensure a well-functioning supply chain that can support the deployment and generation of cost-effective wind energy.
Governments Can Boost Wind Deployment Further
When setting policies to promote wind energy deployment, long-term stability to attract the necessary investments is critical. This includes, setting long-term and well-defined wind energy targets, as well as long-term and stable policy measures. Governments should avoid swings between strong supportive and curbing measures and policy uncertainty that can discourage long-term investments. The expiration of China’s policy support scheme in 2016 provides a good example of how changing incentives can lead to a drop in wind capacity investments. In the U.S., when the IRA tax credits approach their final years, policymakers will have to carefully think of how to avoid such traps.
For wind deployment, governments should find ways to create economies of scale to reduce project costs. Promoting wind projects in clusters can provide operation and maintenance efficiencies and hub grid connections. Moreover, government efforts should streamline the process of applying for grid and construction permits for developers (known as the permitting process), and reduce regulatory restrictions, red tape, and uncertainties. This can provide massive benefits by reducing construction and lead times, investor confidence, and project risks.
When it comes to offshore wind deployment, it is important to adapt policies to specific market conditions. For example, while for developed offshore markets, projects farther offshore might be more cost-effective and efficient to harvest the higher wind speeds, for newly developed markets, such as in the U.S., intertidal and near-shore projects can provide low-hanging fruits given their cheaper cost and low level of needed expertise. According to the IEA, tapping the potential of near-shore (20-50 km) shallow (less than 60 m) waters alone can provide around 36,000 TWh of electricity annually, almost equivalent to global electricity demand in 2040.
Governments should also strive to enable and promote corporate sourcing of wind projects. They should empower businesses to invest in wind energy production for self-consumption, including through the provision of credible and transparent certification and tracking of renewable energy. Moreover, governments should promote a market structure that allows Power Purchase Agreements, enabling companies and wind energy developers to trade renewable energy. The Swedish company IKEA is a case in point for a private business that has purchased several wind farms in North America to decarbonize and self-generate clean electricity of around 400 MW for corporate use.
Whew, Finally!
The exploration of wind energy’s potential, challenges, and investment trends highlights its critical role in the global transition to sustainable energy systems. As nations aim to achieve Net Zero Emissions (NZE) by 2050 and address climate change, wind power emerges as a cornerstone solution alongside solar energy.
We examined the projected exponential growth of wind energy capacity by international agencies like the International Energy Agency (IEA) and the Global Wind Energy Council. However, it also emphasized the significant misalignment between current growth trajectories and the requirements for NZE by 2050. To bridge this gap, concerted efforts are necessary, including proactive policies, increased investments, and innovative solutions.
Despite wind energy’s promise, the narrative reveals various challenges hindering its rapid deployment. From macroeconomic uncertainties to supply chain bottlenecks, the sector faces obstacles threatening project scalability and economic viability. The increasing size of wind turbines poses engineering and logistical challenges, necessitating substantial infrastructure investments and innovative approaches.
Supply chain dynamics, particularly China’s dominance, raise concerns about global dependency and potential disruptions. Although investment trends show promising growth, they fall short of meeting the magnitude needed to achieve NZE targets. The article underscores the importance of long-term policy stability, economies of scale, and international cooperation in driving wind energy deployment.
The introduction of transformative policies like the Inflation Reduction Act (IRA) in the U.S. marks a step towards accelerating renewable energy growth. However, global coordination is essential to address concerns about trade rules and ensure a smooth transition to sustainable energy worldwide. Caution is urged in regional localization efforts to avoid hindering global wind energy deployment.
Wind energy capacity and generation have significantly increased over the past decades due to technology advances, efficiency gains, policy support, and cost savings. Wind will play a crucial role in the transition to Net Zero Emissions by 2050, yet current investments remain insufficient to meet the objectives of the Paris Alignment. Policymakers must create incentives and market structures to support wind investments and deployment.
Regional legislations, such as the IRA in the U.S. or the Net Zero Industry and Critical Raw Materials Acts in Europe, have the potential to transform supply chains and meet growing demand. However, premature localization efforts could backfire, necessitating internationally coordinated efforts to set adequate policies for a smooth energy transition.
Wind energy offers hope for a sustainable future, but with major problems to solve. Collective action, innovative solutions, and unwavering commitment from policymakers, industry stakeholders, and the global community are essential.