

Non-Fed Public Sector Spending Outlook
Executive Summary: The Big Picture
Let’s get something straight right out of the gate: public sector budgets are not imploding. They’re not going to zero. State and local governments, school districts, and public agencies will keep spending money on things they need. That’s not the question.
The question is which budgets, on what, and when. And the honest answer is that the next 1–2 years are going to be genuinely weird — in ways that matter enormously to any vendor using to do business with the public sector.
Here’s the paradox vendors are walking into: the U.S. economy has real momentum (foreign investment is pouring in, tax cuts are stimulating capex), but at the exact same time, the federal government is doing something it’s never quite done before — actively canceling already-awarded grants, slashing agency budgets in real-time, and letting a thing called DOGE run chainsaws through programs that fund the very customers vendors serve.
Add tariffs on steel, aluminum, and just about everything else, and you’ve got a recipe for procurement uncertainty that will separate the vendors who understand their customers’ budget dynamics from those who are just hoping for the phone rings.
The opportunity hasn’t disappeared. It’s just migrated. Find where it went.
What vendors need to know in one sentence: The spending floor is holding, but the ceiling is variable — and the variance is higher than at any point since the 2009 recession.
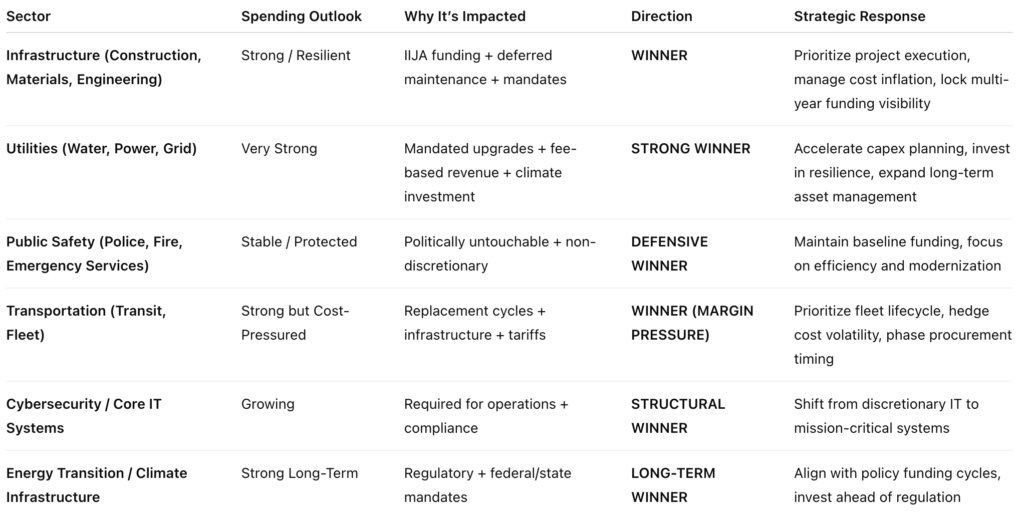
At the end of this research, we provide a sector analysis, outlook, impact and strategies.
I. The Macro Picture: What’s Driving the Bus (and What’s Throwing Sand in the Gears)
A. The Economy: Mostly Good News, With Asterisks
Here’s what’s interesting about the 2026 economy: by most headline measures, it’s performing reasonably well. Unemployment is still low. Wages are up. AI enthusiasm has been juicing income tax collections in California and New York to the point where state budgets look better than anyone expected heading into the year.
But — and this is a big but — that headline story masks real divergence at the ground level. Corporate income taxes are getting softer (Kansas just revised down by $187 million in a single forecast update). Consumer spending is being squeezed by inflation that’s been stickier than the Fed wanted. And the tariff shock is starting to work its way through costs in ways that haven’t fully shown up in the data yet.
1-Year View:
Revenue growth is decelerating. States that benefited from the post-COVID surge (think: 40-50% revenue spikes in 2021-2022) are normalizing fast. As of early 2026, Pew Charitable Trusts found that nominal state revenue growth is running at about 3.7% year-over-year — which sounds fine until you remember inflation is eating most of that alive.
2-Year View:
The economic split deepens. Sunbelt states with population growth and diversified tax bases (Texas, Florida, Arizona) will outperform. Rust Belt and high-cost states face structural gaps. Michigan just revised its revenue forecast down nearly $1 billion citing tariffs and economic uncertainty — a swing that would have been unthinkable six months earlier.
5-Year View:
Structural labor shortages become the dominant economic force. The workforce is aging. Immigration policy is reducing labor supply. And that means two things for vendors: the agencies and districts you sell to will increasingly need to buy technology and automation to replace workers they can’t hire — and that’s a growth market, not a shrinking one.
B. The Federal Fiscal Wildcard: This Is the Part Nobody Fully Priced In
This analysis focuses on state and local governments, school districts, higher education institutions, and nonprofits and public agencies — not the federal government itself. We cover federal fiscal policy here because federal spending decisions directly drive funding uncertainty for these entities.
Okay, let’s talk about the elephant in the room wearing a DOGE t-shirt.
The Trump administration’s FY2026 budget proposed a 22.6% cut — $163 billion — to domestic discretionary spending. That alone would be significant. But what’s unprecedented is the mechanism being used to deliver those cuts.
DOGE didn’t wait for Congress. By January 2026, it had driven the termination of 15,887 federal grants totaling approximately $49 billion — grants that had already been awarded, many of them years into their performance periods. The National Science Foundation lost $1.4 billion in already-awarded grants. AmeriCorps saw nearly $400 million slashed, eliminating 32,000 positions. FEMA resilience programs lost close to $1 billion.
This is different from a budget cut. Budget cuts reduce future funding. What happened here is more like showing up to a construction site mid-build and yanking the foundation. The Urban Institute reported in October 2025 that one in three nonprofit service providers had already experienced a government funding disruption.
Then H.R. 1 added another layer. New Medicaid work requirements start in January 2027. States’ share of SNAP administrative costs rises in October 2026. New Mexico estimates these changes will cost the state $620 million in FY2027 alone — and grow to over $1 billion by 2029. Pennsylvania’s fiscal office described it as a “stimulus in reverse.”
What This Means for Vendors:
Your customers aren’t just facing tighter budgets. Some of them are facing sudden budget voids mid-contract. Map your customer base by federal dependency before renewals. The question to ask: what percentage of this agency’s or district’s operating budget flows through federal sources? The higher that number, the more urgency you should feel about contract timing and terms.
C. Tariffs and Supply Chains: Your Price Is No Longer Your Price
Here’s something fun to think about: you quoted that municipal fleet contract six months ago. Steel tariffs are now at 50% on steel products, 25% on derivatives. Aluminum tariffs are running alongside those. The Associated General Contractors of America is updating their tariff resource center constantly because the situation changes week to week.
The global 10% tariff — set at 150 days and expiring around July 2026 — applies on top of the sector-specific tariffs on steel, aluminum, copper, lumber, automobiles, and parts. According to McKinsey, 82% of supply chain leaders are reporting significant operational impacts from trade policy changes. And 65% of companies are actively changing their sourcing strategies as their primary response.
For vendors selling to the public sector, this creates a specific problem: public procureNSFent contracts are often fixed-price or contain limited escalation provisions. Tariff-driven cost spikes mid-contract is a vendor’s nightmare, not the customer’s. And public agencies are slow to renegotiate.
1-Year View:
Audit your open contracts for cost-escalation language. If you’re bidding on new contracts, build tariff contingency into your pricing. Domestic sourcing certification is becoming a competitive differentiator, particularly for federally-funded projects subject to Buy America requirements.
2-Year View:
Vendors with U.S.-based manufacturing or nearshore supply chains will pick up contracts that international-sourcing competitors lose. This is a structural shift, not a temporary one. By consensus among supply chain leaders, tariffs are now a permanent fixture — not a negotiating tactic.
5-Year View:
Resilience and redundancy become procurement evaluation criteria. Public buyers will increasingly ask: where does this stuff come from, and what happens when the next trade disruption hits? Vendors who can answer that question clearly will win.
II. Segment-by-Segment Spending Outlook: Where the Money Is (and isn’t)
Alright, let’s get specific. Not all public sector spending is moving the same direction at the same speed. Here’s the breakdown you need.
A. State and Local Governments: Steady Eddie, But Watch the Edges
State and local governments are the most resilient segment in this environment — and that’s not just optimism talking. It’s structural. They raise most of their own revenue through property taxes, sales taxes, and income taxes that are relatively insulated from federal budget decisions. When DOGE cuts a grant, it hurts. But it doesn’t crater a state government the way it can crater a nonprofit that was 60% federally funded.
That said, 2026 is a year of budget caution at the state level. As of early 2026, ten states are projected to have a challenging fiscal outlook, and another thirteen are in conditional status. Michigan revised down by nearly $1 billion. Maine’s forecast dropped another $23 million in the most recent update. California’s LAO projects structural deficits growing to $35 billion annually by 2027-28. New York is staring at a $10.0 billion gap in 2027.
The common thread across all of these: the post-pandemic revenue surge is over. States spent it, cut taxes with it, and now must fund programs at higher cost levels without the tailwind.
What’s Still Spending:
- Infrastructure and public works — IIJA (Infrastructure Investment and Jobs Act) funds are still flowing and peak deployment is 2025-2027. This is active money.
- Fleet replacement — deferred during COVID, now catching up. Vehicles age out regardless of budget stress.
- Public safety — police, fire, emergency management spending is non-discretionary and politically untouchable.
- Water and utilities — EPA mandates drive spending independent of budget cycles.
What’s Getting Squeezed:
- Administrative technology projects — easy to defer, first on the chopping block.
- Non-essential facilities upgrades — deferred maintenance grows, but capital projects get delayed.
- New program launches — anything not already underway faces scrutiny.
Variability: MODERATE
The floor is solid. Essential services, infrastructure, and mandated operations will keep spending. The ceiling — discretionary tech, admin upgrades, new initiatives — is variable. Budget for the floor, pitch the ceiling as upside.
Vendor Strategy by Horizon:
- 1-Year: Lead with infrastructure and fleet. Align proposals to active IIJA-funded projects by state. Bundle equipment + service contracts to lock in multi-year relationships before budgets tighten further.
- 2-Year: As IIJA funds hit peak deployment, position for capital equipment cycles in water, transportation, and construction. Growing metros in the sunbelt are the highest-priority geography.
- 5-Year: Technology integration into city operations (predictive maintenance, AI-assisted asset management) becomes standard. Vendors who build those capabilities into their offerings now will own those contract renewals later.
B. School Districts and Higher Education: Two Very Different Movies
If you’re selling to K-12 school districts right now, you need to understand something fundamental: the fiscal landscape looks completely different depending on which district you’re walking into. And the contrast is sharper than it’s been in decades.
Here’s the backstory. The federal government handed schools roughly $190 billion in ESSER (COVID relief) funds across three rounds. For a handful of states, the last tranche had to be spent by March 2026. (Many others had earlier spend-by dates of Sept. 2024 or Jan. of 2025.) Districts that used this money to hire permanent staff — and many did — are now dealing with structural budget gaps because those salaries don’t disappear when the federal money does.
McKinsey projects per-pupil spending will be essentially flat in nominal terms through 2026-27 — which means real (inflation-adjusted) declines, since inflation is still running around 3%. In a recession scenario, state funding could drop 6.5%, creating a $29 billion funding hole across the sector. More than half of district budget decision-makers expected a fiscal cliff when ESSER concluded.
Meanwhile, enrollment is declining in ways that are structural, not cyclical. Birth rates have been falling since the Great Recession. Pandemic-era family relocations shifted student populations. School choice expansion is pulling students to charters and homeschooling. Because most states fund schools on a per-pupil basis, fewer students literally mean less money — but the buildings still need to be heated.
The Higher Ed Split:
This is where it gets interesting. Major research universities and flagship campuses are growing — demand for four-year degrees from high-income families remains strong, and foreign enrollment has historically been a revenue cushion. But regional universities and community colleges serving working-class students are facing an enrollment cliff that could turn existential over a five-year horizon. The federal cuts to research grant indirect costs (NIH slashed payments for research infrastructure in early 2025) are adding stress to even the well-resourced institutions.
What’s Still Spending:
- Facilities maintenance and deferred repairs — the backlog built during COVID is enormous and legally mandated compliance is driving action.
- School safety and security — politically non-negotiable in the current environment.
- Food service and nutrition — federal programs still fund this substantially.
- Technology infrastructure — districts need connectivity and devices as baseline, not luxury.
What’s Getting Squeezed:
- Teacher and staff positions — the most expensive line item, and the one taking the biggest hits.
- Arts, music, enrichment programs — always first to go when budgets tighten.
- Administrative technology projects — nice to have, easy to defer.
Variability: HIGH
This is the most volatile segment in the near term. Some districts will be buying aggressively as IIJA and deferred maintenance catch up. Others are in a genuine financial crisis. You need to know which type you’re dealing with before you invest sales resources.
Vendor Strategy by Horizon:
- 1-Year: Focus on deferred maintenance and facilities — the most defensible spend category in any budget environment. ROI documentation is non-negotiable. Identify enrollment-declining districts early and treat them as higher renewal risk.
- 2-Year: As budgets stabilize from the ESSER cliff (2027-28 is projected to see funding resume growing), position for the facilities upgrade wave. Districts that survived the cliff will have pent-up demand.
- 5-Year: Technology and AI tools for learning efficiency become budget line items, not pilots. Vendors with education-specific solutions for learning analytics and operational efficiency will find growing markets in the districts that are thriving.
C. Nonprofits and Public Agencies: In the Eye of the Storm
Let’s be direct: this is the highest-risk segment for vendors right now, and it’s going to get more complicated before it gets easier.
The combination of DOGE grant terminations and the H.R. 1 federal spending package is hitting nonprofits and public agencies like a double punch. Remember those 15,887 DOGE grant terminations totaling $49 billion? Nonprofits took a disproportionate share of that. A survey by Instrumentl found that 85% of nonprofits report experiencing some impact from federal funding changes — 51% have already lost federal, state, or local grant funding, and 24% have been forced to reduce staff or contractor capacity.
Here’s the thing that makes this particularly tricky for vendors: even the nonprofits whose grants weren’t terminated are operating in a procurement freeze because they don’t know what’s coming next. Procurement uncertainty has the same practical effect as a budget cut — decisions don’t get made.
The Urban Institute reported that one in three nonprofit service providers experienced a government funding disruption in just the first four to six months of 2025. That’s a staggering number for a sector that was already operating on thin margins.
Where the Pockets of Stability Are:
- Core operational needs — vehicles, facilities, essential IT that keep the doors open regardless of program funding.
- Endowment-funded institutions (arts, education, community foundations) — these behave more like private sector buyers.
- Healthcare-adjacent agencies — Medicaid and health services remain funded even as other programs are cut.
- Public housing authorities — housing needs are growing, and federal housing programs have proven more durable than social service grants.
Variability: VERY HIGH
This segment requires a different approach. Don’t pitch big multi-year capital contracts to an agency that doesn’t know if its primary funding source will exist in six months. Do pitch mission-critical operational needs with short initial terms and clear renewal options.
Vendor Strategy by Horizon:
- 1-Year: Track federal grant calendars and time proposals around known funding windows. Build flexibility into contract terms. Focus exclusively on mission-critical categories — efficiency and compliance framing over new capabilities.
- 2-Year: Agencies absorbing reduced federal transfers will shift to shared-service models and efficiency-driven procurement. Vendors who can demonstrate operational consolidation and cost reduction will win.
- 5-Year: Structural consolidation is coming — fewer but larger agencies with bigger contracts and more sophisticated procurement. Position for that future, not the current fragmented landscape.
D. Special Districts (Water, Utility, Transit, Fire): The Hidden Gem Hiding in Plain Sight
If you want to sleep well at night about your public sector pipeline, pay attention to this segment.
Special districts — water authorities, electric utilities, transit agencies, fire districts — operate on a fundamentally different financial model than every other segment. They don’t depend on tax revenue or federal grants for their core operations. They collect rates and fees from ratepayers, and those rate structures are set by regulatory bodies, not by Congress.
When DOGE cuts grants, water districts keep buying pipe replacement equipment. When state revenue declines, the transit authority still needs to replace its bus fleet. When school districts freeze discretionary spending, the fire district still must upgrade its communications infrastructure.
And here’s the kicker: this is also the segment with the most mandatory spending growth built in. EPA mandates on lead pipe replacement, clean water standards, and stormwater management are driving billions in infrastructure investment that isn’t optional. Climate-driven infrastructure investment for water resilience and grid hardening is creating entirely new procurement categories. A 64% majority of supply chain executives are already regionalizing supply chains — and utilities and water districts are leading that shift.
Variability: LOW
This is the anchor of your public sector strategy. Budget with confidence in this segment. Discretionary technology projects carry some variability, but the core infrastructure, fleet, and safety categories are as close to guaranteed spending as the public sector gets.
Vendor Strategy by Horizon:
- 1-Year: Get into active procurement processes now. Water infrastructure, fleet, and operational technology are moving. IIJA funds reaching project-ready status are accelerating timelines.
- 2-Year: Position around lifecycle management, predictive maintenance, and regulatory compliance — the three things every special district procurement officer is evaluated on.
- 5-Year: This is your best long-term contract pipeline. AI-assisted monitoring, predictive asset management, and digital twin technologies will be standard operating procedure by 2031. Start building those capabilities into your offerings now.
III. The Four Scenarios That Will Determine Your Next Five Years
Look, nobody can tell you exactly what the economy will do, what Congress will pass, or whether the next tariff announcement will come on a Tuesday or a Thursday. But we can give you four scenarios and be honest about what each one means for your pipeline.
Scenario 1: Soft Landing (Call it 40% Likely)
The economy keeps growing at a moderate pace. Inflation settles to 2.5-3%. Federal fiscal cuts are painful but implemented more slowly than initially announced. States manage their budget gaps without dramatic service reductions.
What it means for vendors: Steady Eddie. Your cooperative purchasing advantage holds. State and local governments keep buying infrastructure and fleet. School districts stabilize after the ESSER cliff. Special districts remain your most reliable segment. This is the environment where being on a contract and executing consistently wins.
Scenario 2: Federal Fiscal Stress Escalates (35% and rising)
Deficit reduction pressures accelerate. More grant programs get cut or restructured. H.R. 1 Medicaid and SNAP changes hit states harder than projected. Nonprofits and social service agencies face a genuine funding crisis.
What it means for vendors: The divergence between segments becomes stark. Nonprofits and grant-dependent agencies contract significantly. School districts face extended budget pressure. But state/local governments with strong own-source revenue hold relatively steady, and special districts barely notice. Strategy: actively shift your pipeline toward fee-based, own-revenue segments. Accelerate contract closings before grant uncertainty spreads further.
Scenario 3: Inflation and Supply Chain Shock (20% but Underappreciated)
Tariff escalation or a geopolitical energy shock drives cost increases of 15-25% in key categories. Middle East conflict spreads or deepens. The Fed is forced back into a tightening posture just when everyone thought they were done.
What it means for vendors: Procurement freezes hit price-sensitive segments first. Agencies that budgeted based on pre-tariff pricing face mid-year gaps. But domestic suppliers and vendors with certified U.S. supply chains gain significant competitive advantage. This scenario accelerates the strategic shift: vendors who can guarantee domestic sourcing and stable pricing will take market share from those who can’t.
Scenario 4: Recession (15% Probability, But Growing Monthly)
GDP contracts. Tax revenue collapses faster than states can adjust. Federal stimulus is delayed or insufficient. The parallels to 2009 become unavoidable.
What it means for vendors: Capital spending gets deferred 12-24 months. The playbook from 2009-2011 applies: shift your entire strategy to MRO, facilities management, and recurring service contracts. Operations and maintenance spending is non-deferrable — agencies can delay buying new equipment, but they can’t let existing equipment break down. Vendors with strong service contract portfolios will weather a recession significantly better than those dependent on capital sales.
IV. The Procurement Revolution: How the Game Is Changing
There’s something important happening in how public sector entities buy things, and it’s happening faster because of the budget pressures we’ve been describing.
Cooperative purchasing is winning. When budgets are tight and procurement staff are stretched (and they are — agencies have been losing staff faster than they can hire), the appeal of a pre-competed contract is enormous. One procurement officer, one process, access to vetted vendors at competitive pricing. The math is compelling. Multnomah County modernized its procurement process and reduced cycle times by 50%. That efficiency dividend is exactly what constrained agencies are hunting for.
Vendor consolidation is accelerating. Agencies don’t want 20 vendors. They want 3-5 that can handle multiple categories and reduce administrative overhead. Vendors who can bundle equipment, service, and software are being prioritized over those who offer single-category solutions. This is structural, not cyclical.
Multi-year contracts are becoming essential. Inflation uncertainty has made fixed pricing over multiple years genuinely valuable to public buyers. If you can offer a three-year contract with CPI-capped escalation, you’re providing a service that agencies genuinely need: budget predictability.
AI is entering procurement — faster than most vendors realize. AI is embedded in procurement processes for evaluation, compliance monitoring, and risk assessment. According to public procurement research, digitally advanced procurement teams capture up to 96% more savings than manual processes. As agencies digitize, the bar for vendor responsiveness and documentation quality rises.
V. The Strategic Playbook: What to Actually Do
Enough analysis. Here’s what smart vendors are doing right now.
Right Now (Next 12 Months)
- Map your customer base by federal dependency. Pull your contract list and honestly assess: what percentage of each customer’s operating budget is federally derived? Nonprofit clients at 60% federal funding are at a higher renewal risk than municipal clients at 15% federal funding. This should inform your renewal prioritization.
- Audit your contract language for tariff protection. If you have open contracts that don’t include cost-escalation provisions, now is the time to have those conversations. Steel and aluminum tariffs at 50% are not absorbed silently. Know your exposure before it becomes a crisis.
- Accelerate contract closings with infrastructure-adjacent clients. State/local governments with active IIJA-funded infrastructure projects are the best-positioned buyers right now. Get in front of them before budget caution tightens further.
- Certify domestic sourcing where you can. Buy America requirements are expanding for federally funded projects. If your products qualify, make that front and center in your proposal language.
The 2-Year Build (2026-2027)
- Develop bundled solutions. Equipment + service + software in a single contract is the future of public sector procurement. It creates switching costs that protect renewal rates and reduces the administrative burden agencies are desperately trying to cut.
- Target growing geographies, not just growing segments. Sunbelt states (Texas, Florida, Arizona, Georgia) with population growth and strong own-source revenue are the best 2-year growth markets. Focus sales investment there.
- Position for the K-12 facilities wave. The deferred maintenance backlog in school facilities is massive and growing. As school budgets stabilize from the ESSER cliff (projected 2027-28), that backlog becomes active procurement. Vendors who’ve built relationships now will win those contracts.
The 5-Year Horizon
- Special districts are your anchor. The single most reliable long-term growth segment in the public sector. Water, utility, transit, fire — these entities will keep buying through every economic scenario. Prioritize these relationships above all others for long-term contract investment.
- Build toward outcome-based contracts. The next frontier in public procurement is paying for performance, not just products. Vendors who develop the capability to structure and manage outcome-based contracts will command premium pricing and deeper relationships.
- Nationalize through . Regional vendors who can’t leverage a national cooperative contract are going to face consolidation pressure. The vendors who win at scale will be those who use it as a distribution platform across multiple geographies and segments simultaneously.
The Bottom Line
Public sector spending in 2026 and beyond is not a simple story. It’s not “everything is fine” and it’s not “everything is falling apart.” It’s a story of divergence: between segments, between geographies, and between categories within segments.
The vendors who will thrive aren’t the ones with the best product catalog. They’re the ones who understand their customers’ budget dynamics deeply enough to know when to push and when to wait, what to pitch and what to leave for later, and where the money is flowing versus where it just looks like it’s flowing.
The question for vendors isn’t whether public sector customers will keep spending. They will. The question is whether you understand their budget well enough to be there when they do.
Non-Fed Public Sector Spending Analysis
Research Sources & References
1. State & Local Revenue
1. State Tax Revenue Stabilizes Amid Rising Fiscal Uncertainty — Pew Charitable Trusts, April 2026. Source for 40 states underperforming 15-year revenue trajectories entering FY2026.
2. States Tread Carefully With Budgets as Gaps and Revenue Uncertainty Loom — Pew Charitable Trusts, July 2025. Source for 3.7% nominal state revenue growth figure.
3. ‘Tough Decisions’ Coming as Michigan Faces $1 Billion Budget Hole — Bridge Michigan, January 2026. Source for Michigan’s ~$1.1 billion combined GF/SAF revenue revision.
4. Forecast: Tariffs Cloud Michigan Economy, Auto Industry — Crain’s Detroit Business, May 2025. Additional Michigan tariff and revenue impact data.
5. The 2026-27 Budget: California’s Fiscal Outlook — California Legislative Analyst’s Office, November 2025. Source for $35 billion annual structural deficit projected starting 2027-28.
6. New York City FY2027 Budget Preview — NYC Comptroller Mark Levine, January 2026. NYC fiscal gap analysis.
7. DiNapoli Releases Report on FY2027 Proposed Executive Budget — New York State Comptroller, February 2026. NY State outyear gap projections.
2. Federal Fiscal Policy & DOGE
8. DOGE Savings — doge.gov — Department of Government Efficiency (official). Source for 15,887 grant terminations totaling ~$49 billion (data as of January 1, 2026).
9. President Trump’s FY2026 Discretionary Budget Request — White House OMB, May 2025. Source for 22.6% / $163 billion non-defense discretionary cut proposal.
10. DOGE Has Terminated Nearly 16,000 Federal Grants — GrantedAI, March 2026. Detailed breakdown of DOGE grant terminations by category.
11. We Must Act Now to Save AmeriCorps — The Corps Network. Source for ~$400 million AmeriCorps grants terminated, 32,000+ positions impacted.
12. NSF Grants in 2026: $8.75 Billion Appropriated, 1,752 Grants Terminated by DOGE — Funding Landscape, February 2026. Source for NSF grant terminations ($1.4 billion, 1,752 grants). Note: document cites $1 billion — actual figure is $1.4 billion.
13. DOGE Interference in Federal Grantmaking Adds Burden, Uncertainty, and Risk — Center on Budget and Policy Priorities, May 2025. Policy analysis of DOGE grant termination mechanisms.
14. How Are H.R. 1 Cuts and Changes to Medicaid and SNAP Playing Out in 2026 State Legislative Sessions? — Georgetown Center for Children and Families, March 2026. H.R. 1 Medicaid and SNAP state-level impacts.
15. New Mexico Medicaid Changes — Health Care Authority — New Mexico Health Care Authority. State-level H.R. 1 fiscal impact data.
3. Education (K-12 & Higher Ed)
16. From Surplus to Scarcity: K-12 Districts Brace for Leaner Years — McKinsey & Company, September 2025. Source for per-pupil spending flat through 2026-27, 6.5% recession scenario, and $29 billion funding hole.
17. Elementary and Secondary School Emergency Relief Fund — U.S. Dept. of Education — U.S. Department of Education. Official source for ESSER I/II/III allocations totaling ~$190 billion.
18. With ESSER Expiration, COVID-19 Spending Prepares for Finale — K-12 Dive, September 2024. ESSER deadline details; standard obligation deadline was Sept 30, 2024.
19. When the Money Runs Out: K-12 Schools Brace for Stimulus-Free Budgets — McKinsey & Company, September 2024. Source for district fiscal cliff concerns and ESSER expiry impacts.
4. Nonprofits & Public Agencies
20. The New Funding Rush: How Nonprofits Are Racing to Adapt Amid Federal Grant Changes — Instrumentl, 2025. Source for 85% of nonprofits impacted, 51% lost funding, 24% reduced staff figures.
21. How Government Funding Disruptions Affected Nonprofits in Early 2025 — Urban Institute, October 2025. Source for ‘one in three nonprofit service providers experienced a government funding disruption.’
22. 1 in 3 US Nonprofits That Serve Communities Lost Government Funding in Early 2025 — The Conversation / Urban Institute, October 2025. Summary of Urban Institute findings.
23. Survey: US Nonprofits at Critical Point as Funding for Community Needs Falters — Nonprofit Finance Fund, June 2025. 2,206-nonprofit survey on financial health and federal funding impacts.
5. Supply Chain & Tariffs
24. Supply Chain Risk Pulse 2025: Tariffs Reshuffle Global Trade Priorities — McKinsey & Company, December 2025. Source for 82% of supply chain leaders reporting tariff impacts. NOTE: Document cites 86% — correct figure from this authoritative survey is 82%.
25. Report: 86% of Supply Chain Leaders Feeling Tariff Impact — The Shelby Report / RELEX Solutions, March 2026. Source for the 86% figure (514 retail/manufacturing/wholesale leaders, Jan 2026 survey). Distinct from McKinsey survey.
26. Supply Chains Under Pressure: Strategies for a Shifting Tariff Landscape — KPMG, June 2025. Survey of 300 C-suite executives on tariff supply chain responses. Source for 46% shifting to domestic sourcing.
27. Revamped Supply Chain Strategies Can Help Mitigate Tariff Impacts — KPMG, November 2025. Follow-up survey on tariff mitigation strategies.
28. Executive Directive 2026-2: Ongoing Impact of Tariffs on Michigan’s Economy — Michigan Governor Whitmer, April 2026. State-level tariff impact documentation.
6. Procurement & Special Districts
29. Associated General Contractors of America — Tariff Resource Center — AGC of America. Referenced for ongoing construction/materials tariff tracking.