


A Guide for the Construction Industry and the AI Ecosystem
AI has entered the physical economy. What began as a race for faster chips and smarter models is now a race for electricity, land, equipment, skilled labor and permission to build. The money is extraordinary. Capital alone does not create capacity. The winners will close the gap between the speed of AI ambition and the speed of construction delivery.
Prepared for general contractors and specialty trades, construction and program managers, architects and engineers, manufacturers and distributors, utilities, data center developers, hyperscalers and AI companies, infrastructure investors and lenders, public and private owners, and policymakers.

Scope and Methodology
This paper combines public economic, construction, energy, policy and corporate data with field research across eight industries on the construction side of the AI build chain in 2026: general contracting, electrical contracting, construction management, electrical distribution, ICT and structured cabling, ready-mix concrete, roofing and building envelope, and public cooperative procurement. Field research shaped the questions. Every figure in the paper comes from a public source listed at the end.
The scope is U.S. nonresidential, data center, energy, industrial, institutional and infrastructure construction, plus the AI companies and investors paying for the build. Residential construction appears only as rate context. The material is for educational purposes and does not constitute investment, legal, tax, procurement or policy advice.
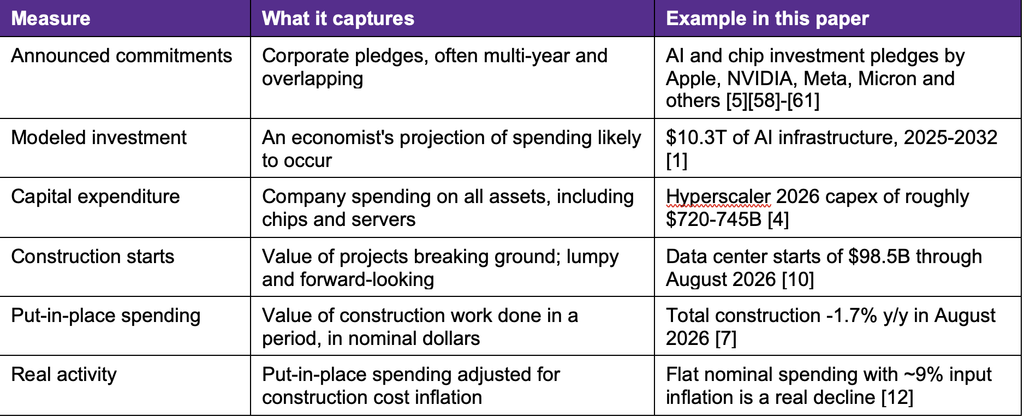
One rule runs through the research: different numbers measure different things. Announced commitments, modeled investment, corporate capital expenditure, construction starts, construction put in place and inflation-adjusted activity are not interchangeable. Each figure below names what it measures.
I. Executive Summary
Construction is not booming. It is not busting. It is splitting. AI has turned a technology cycle into a physical build cycle, and the physical side runs on its own clock. Chips and models improve in months. Power plants, substations, switchgear, permits and crews take years.
That gap is the Construction Reset. The construction economy is now divided between abundant investment opportunity and constrained delivery capacity. Data center construction is running at a record pace while total construction spending is falling. Owners want speed. The physical economy sells time.
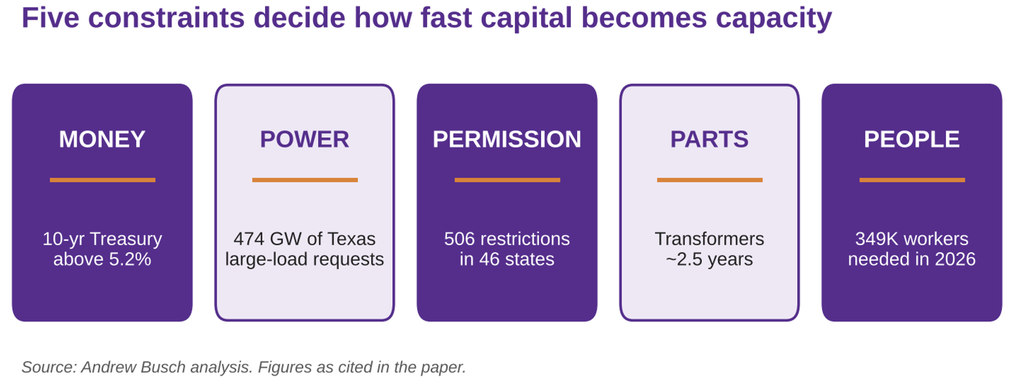
Five constraints decide how fast capital becomes capacity: Money, Power, Permission, Parts and People. Each one has taken a turn as the binding constraint in 2026. None of them is going away by 2030.
The paper asks two questions. First, can the physical economy deliver what AI is ordering? Second, can AI earn returns fast enough to pay for what is being built for it? Who captures the value along the build chain depends on both answers.
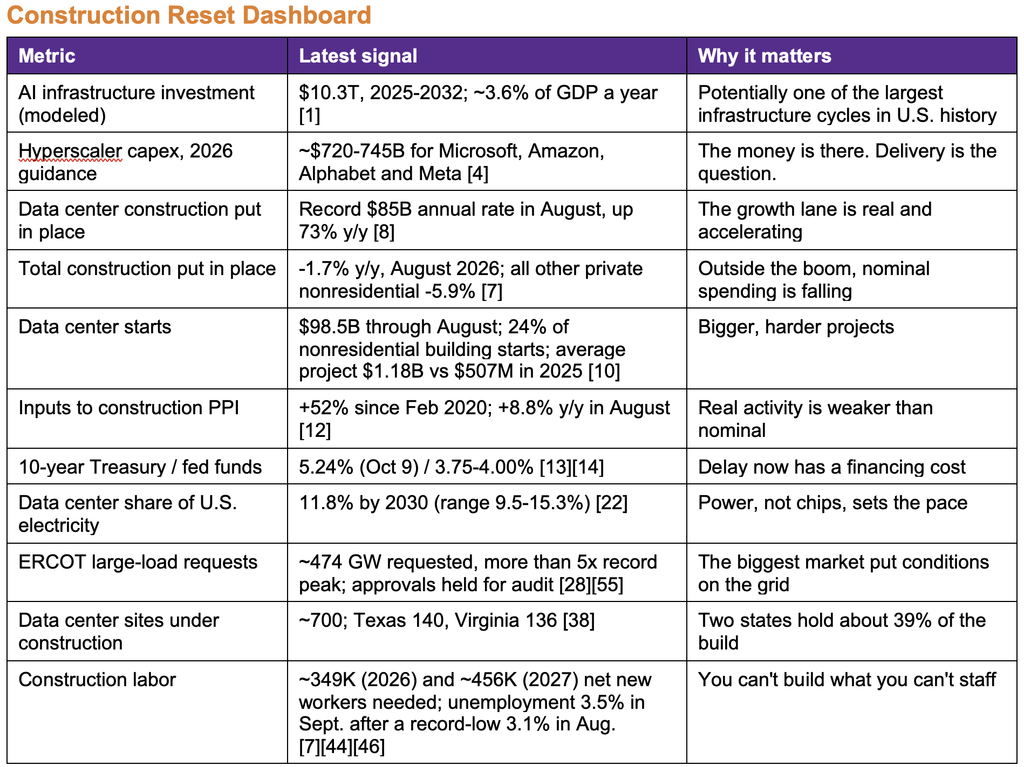
- AI goes physical. A Brookings model estimates about $10.3 trillion of U.S. AI infrastructure investment from 2025 through 2032, about 3.6% of GDP a year, above the 2.24% peak of the railroad era [1][3]. It is a modeled estimate covering data centers, chips, networks and energy. Only part of it is construction.
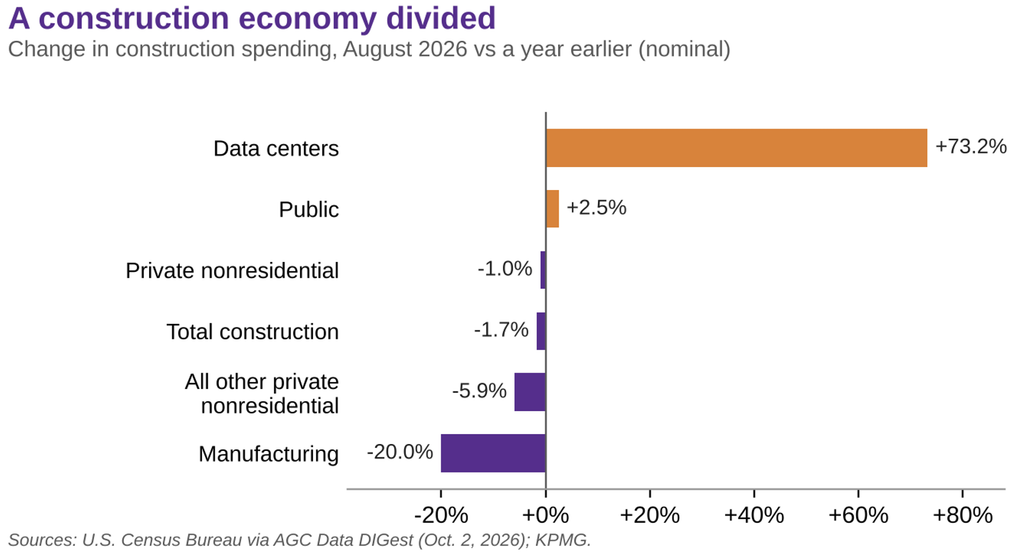
- The divided construction economy. Total construction put in place was down 1.7% from a year earlier in August 2026 [7]. Data center construction hit a record $85 billion annual rate, up 73% [8]. All other private nonresidential construction combined was down 5.9% [7].
- The five constraints. The 10-year Treasury sits above 5.2% [14]. Texas has held data center grid approvals for an audit, New York has paused state environmental permits for large facilities, and Virginia has pulled back state fast-track help [28][31][33]. Large power transformers take about two and a half years to arrive [56]. Contractors need roughly 349,000 net new workers in 2026 and 456,000 in 2027 [44].
- The return question. Coverage of the same Brookings model notes it implies AI services revenue of roughly $3.5 trillion a year by 2032 to justify the build [2]. Today’s revenue is a fraction of that. The build is a bet on adoption.
- AI inside construction. The gains are real in administrative work. Promised field productivity gains are not yet met.
The core implication is simple. For builders, the competitive edge is shifting from winning projects to executing them profitably. For the AI ecosystem, it is shifting from counting capex to buying delivery.
II. The Great AI Construction Mismatch
AI has left the digital world. It now lives in concrete, steel, copper and electricity. And that world doesn’t do exponential.
Start with the headline number. A paper for the Brookings Papers on Economic Activity by Columbia economist Stijn Van Nieuwerburgh, reported by The Wall Street Journal, puts U.S. AI infrastructure investment at about $10.3 trillion from 2025 through 2032 [1][3]. That averages about 3.6% of GDP a year. The railroad build-out peaked at 2.24%. Highways ran about 1.13% [3]. Goldman Sachs puts AI investment at about 1.9% of GDP in 2026 alone [3].
Respect the number. Then take it apart. It is a modeled estimate, not committed or realized spending. It covers data centers, chips, networks and energy, and the model already discounts projects unlikely to be built [2]. Potentially one of the largest infrastructure investment cycles in U.S. history? Yes. A $10.3 trillion construction boom? No.
Here is the distinction that matters for every builder and every investor: AI infrastructure investment is not the same as construction spending. A dollar spent on an imported GPU is not a dollar spent on U.S. concrete, copper or electrical labor. Census data center construction figures exclude servers, chips and land. The headline tells you the size of the bet. It does not tell you the size of your market.
Commitments are not capacity
The commitments are enormous and overlapping. OpenAI’s Stargate venture was announced at $500 billion [58]. Apple pledged $600 billion [59], NVIDIA up to $500 billion [60], and Meta $600 billion through 2028 [61]. Micron raised its U.S. plan to about $250 billion in July 2026 [5]. Hyperscaler capital spending guidance for 2026 adds up to roughly $720-745 billion across Microsoft, Amazon, Alphabet and Meta [4]. These numbers are not additive, and they change every quarter.
Announcements also reverse. In early 2025, analysts at TD Cowen reported that Microsoft canceled or deferred leases on up to 2 gigawatts of planned data center capacity [6]. Interconnection queues tell the same story at scale. ERCOT, the Texas grid operator, is fielding about 474 gigawatts of large-load requests, more than five times its record peak, and about 90% of them are data centers [55]. In a 2024 EPRI survey, none of the utilities whose data center requests equaled half or more of their peak load forecast data centers above 35% of their load five years out [24]. Developers file duplicate requests to hedge. A request is a wish. A building is a fact.
The AI Infrastructure Conversion Funnel
The best way to see the mismatch is as a funnel. Capital enters at the top. Productive capacity comes out the bottom. Every stage loses projects.
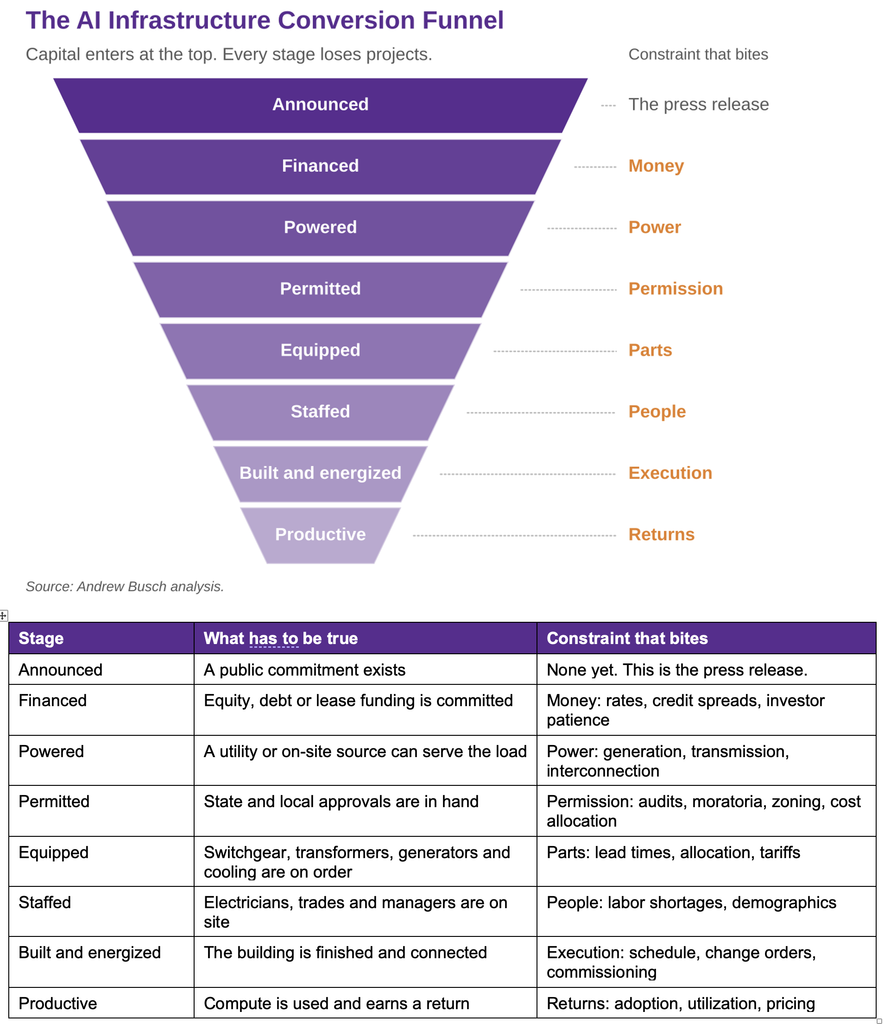
The rest of this paper walks down the funnel. The five constraints sit inside it. So does the question nobody likes to ask at the top: will the bottom of the funnel pay for the top?
AI infrastructure economics: can the returns keep up?
The construction industry has spent two years asking whether it can keep up with AI. The better question for 2027 is whether AI can keep up with its own construction bill.
Coverage of the Brookings model notes that it implies AI services revenue of about $3.5 trillion a year by 2032, roughly 8.8% of GDP, to justify the build. The same coverage estimates the two leading AI labs might reach about $300 billion a year by the end of the decade [2]. Treat both as model outputs, not forecasts. The gap between them is the risk every builder is quietly underwriting.
- Revenue versus capex versus cash flow. Hyperscalers are funding much of the build from operating cash flow, increasingly supplemented by debt and leases. Watch the ratio of AI revenue to AI capex, not the capex alone.
- Demand absorption. Inference and enterprise adoption have to fill the capacity being built. Underused capacity slows the next round of orders.
- Obsolescence and utilization. GPUs age fast. Rack densities, cooling designs and power specifications keep changing. Fast-changing specs strand designs and generate change orders.
- Overbuild and scarcity at the same time. Some metros may end up with more capacity than demand while others cannot get power at any price. The map, not the national total, decides your pipeline.
- Backlog quality. Backlog backed by a creditworthy hyperscaler is a different asset from a speculative developer pipeline waiting on financing and power.
Builder takeaway. Underwrite the customer behind the project, not the press release. Ask who pays if the project stalls between Financed and Energized.
AI ecosystem takeaway. Treat construction capacity as a strategic input, like chips. Lock in builders, gear and power the way you lock in GPU allocations.
Investor takeaway. Model AI returns, utilization and refresh cycles alongside capex. The construction cycle is downstream of that math.
2027-2031 Forward Look. Through about 2030, AI capex is the swing factor in U.S. nonresidential construction. If returns lag, the pullback will not be national. It will hit speculative pipelines and power-poor metros first.
Why speculative pipelines first? Because that is where the soft money sits. When SemiAnalysis tracked this year’s data center delays, almost all of the flagged capacity sat in the early-stage “announced” bucket. Projects with site control, ordered equipment and an interconnection agreement mostly stayed on schedule [66]. The chairman of the Texas PUC says a lot of the state’s 474 GW queue is speculative [67]. ERCOT’s first study set provisionally excluded 302 GW across 373 projects, pending the audit [30]. The committed end looks different. In CBRE’s primary markets, 80.4% of capacity under construction was preleased in the first half of 2026, up from 74.3% a year earlier [68]. A preleased building has a tenant. A press release does not.
Why power-poor metros? Because power is the clock. CBRE calls power availability and delivery timelines the most decisive factors in site selection [68]. Grid connections run 7 to 10 years in several metros [66]. In Santa Clara, home of Nvidia, finished data centers have stood empty waiting for power, and the city utility does not expect its system upgrade to finish until 2028 [69]. In a pullback, capital will not wait years for a connection. It will consolidate where power is already delivered.
III. A Construction Economy Divided
Averages lie. The 2027 construction market is not weak. It is narrow. A firm’s outcome now depends more on its segment, customer and geography than on the national cycle.
The numbers line up once you define them. Total construction put in place was $2.20 trillion at an annual rate in August 2026, up 0.9% from July but down 1.7% from a year earlier. Private nonresidential spending was down 1.0%. Manufacturing construction was down 20%. Public spending was up 2.5% [7][9]. Those are nominal figures. Inputs to construction rose 8.8% in the year to August, so the real decline is deeper [12].
Inside that decline sits the boom. Data center construction hit a record $85 billion annual rate in August, up 73% from a year earlier [8]. Everything else in private nonresidential construction combined was down 5.9% [7]. Starts tell the same story. Data center starts reached $98.5 billion through August 2026, about 24% of all nonresidential building starts. The average project cost $1.18 billion, up from $507 million in 2025 [10]. Bigger, harder projects.
The forecasters agree on the shape. The American Institute of Architects’ July 2026 consensus has nonresidential building spending falling 0.3% in 2026 and rising 3.0% in 2027. Commercial grows 4.8% and 5.8%, but excluding data centers it is roughly -1% and +1%. Manufacturing falls 11.6% in 2026 and another 0.6% in 2027. Institutional grows a steady 2.8% and 2.7% [11]. A reacceleration, not a boom.
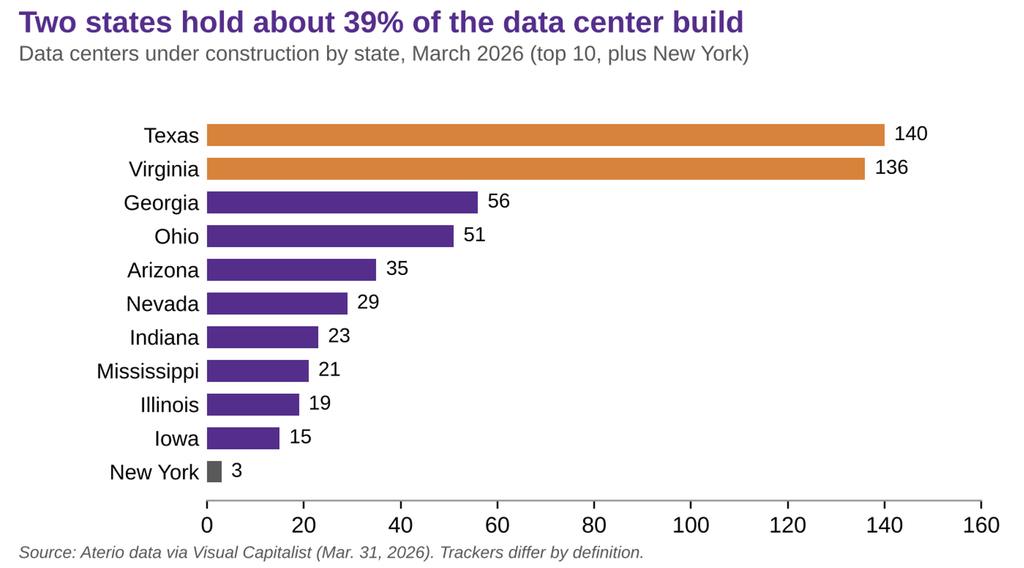
And the build is concentrated. About 700 U.S. data centers were under construction as of March 2026. Texas had 140. Virginia had 136. Then Georgia (56), Ohio (51) and Arizona (35). Texas and Virginia alone hold about 39%. New York had three [38]. Trackers differ by definition, so name the tracker every time; another count shows 400 facilities under construction and 1,199 planned as of October 2026 [53].
Growth versus displacement
It is tempting to say AI is crowding out everything else. Data center outlays are soaring while other categories shrink. Some displacement is real, especially for specialized electricians, switchgear and transformers in the hottest metros.
But the weakness elsewhere has other causes too: a 5% 10-year Treasury, public funding cliffs and sector-specific demand. Manufacturing construction is falling after an earlier surge. Office is still working through a glut. A fair reading is that AI is crowding out work in specific labor markets and supply chains, not across the whole economy. The test is straightforward and worth running: compare construction costs, labor availability and project delays in high-data-center-growth metros against similar metros without the boom. That comparison would show where displacement is real and where it is a convenient story.
More demand does not guarantee more margin
An extraordinary investment cycle can destroy value for contractors who underestimate complexity, carry expensive inventory or sign poorly structured contracts. Revenue is the easy part.
The pressure shows up in the balance sheet. In ServiceTitan’s 2026 survey of commercial specialty contractors, 67% use lines of credit to fund materials and 56% are negotiating longer payment terms with suppliers. More than three-quarters have at least nine months of secured work, and 41% have more than a year [18]. This market is not short of work. It is short of margin and cash conversion.
Suppliers are passing costs through in public. Carlisle’s CFO told investors in July that the company had announced three broad-based price increases and implemented freight surcharges [19]. When physics moves, everybody sends the same letter. The only variable is who wrote a contract that survives it.
There is a floor under some of this. Owens Corning’s CEO said more than 80% of its roofing demand comes from repair and replacement [20]. Carlisle reported reroofing up about 3% in the second quarter while commercial new construction fell by mid-single digits [19]. Roofs don’t read the yield curve. They leak on schedule.
Builder takeaway. Decide explicitly: build the mission-critical credential, partner into it, or own the public and institutional work others neglect. Build data center capability, not data center concentration.
Investor takeaway. Separate companies with pricing power from companies with more revenue. Compare backlog growth with gross margin, working capital, change orders and cash conversion.
2027-2031 Forward Look. Data center construction stays the growth lane through about 2030, with power and permission deciding which metros get it. The non-data-center recovery, if it arrives in 2027, arrives at a higher cost of capital.
IV. Money: Financing the Build
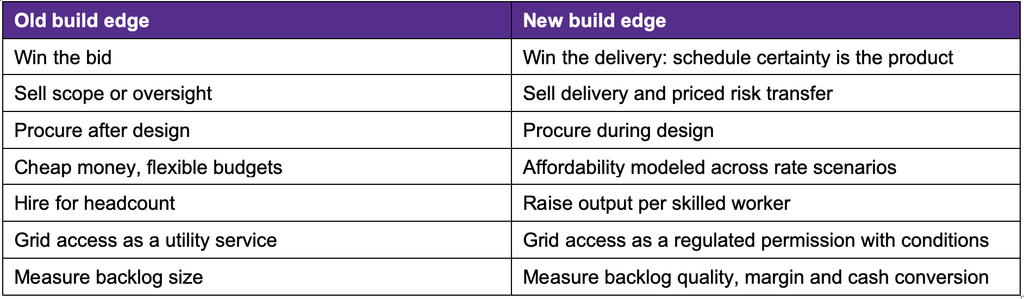
Higher for longer interest rates are not just a housing story. They raise owner hurdle rates, contractor working capital needs and the value of every week of schedule certainty.
The Federal Reserve raised its target range to 3.75-4.00% on September 16, 2026, in a unanimous vote, its first hike in about three years [13]. Long rates moved first. The 10-year Treasury was 5.27% on October 6, up from 5.01% on September 18 [14]. The Congressional Budget Office projects federal debt held by the public at about 100% of GDP in 2026, rising to a record 120% by 2036 [15]. The long end of the curve is pricing a lot of debt.
Same referendum. Same debt service. Smaller school.
Public owners feel this through the bond market. The AAA 30-year municipal yield was 5.11% on October 5, 2026 [16]. Five years earlier, almost to the week, it was 1.69% [57]. Hold the annual debt service constant on a 30-year, level-payment bond and the borrowing capacity falls by about a third. At 1.69%, every $1 of annual payment supports about $23.40 of principal. At 5.11%, it supports about $15.20. That is roughly 35% less bond principal for the same tax levy. Then the construction dollar buys less on top of that.
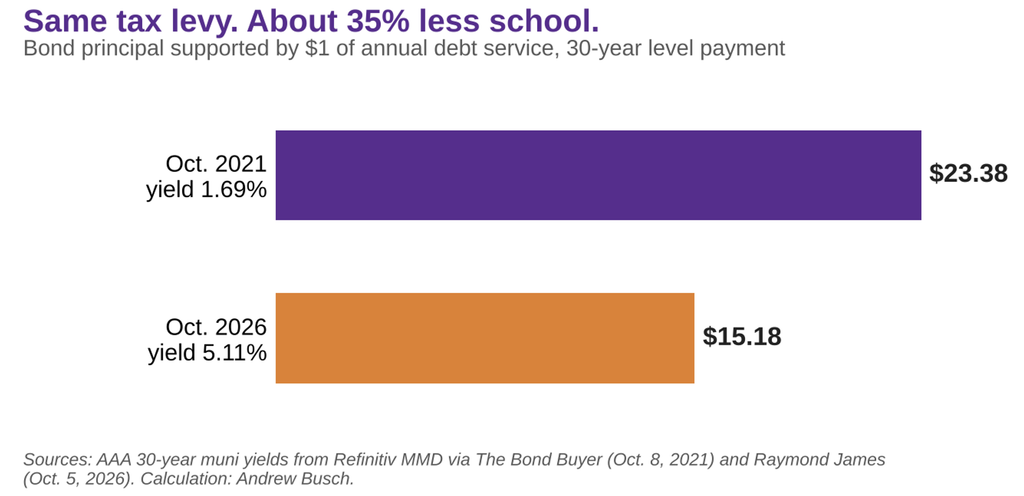
And that is before construction inflation. Inputs to construction are up about 52% since February 2020 [12]. The same referendum, with the same debt service, buys a much smaller school. Nothing in the cost estimate caused it. Nothing in value engineering fixes it.
A financing event called a delay
For the AI ecosystem, money shows up as the cost of time. At 5%-plus rates, a six-month slip on a large data center campus is not a scheduling problem. It is a financing event. Interest, idle equipment and delayed revenue compound while the building waits for gear, power or permits.
Tax policy adds clocks of its own. The One Big Beautiful Bill Act made 100% bonus depreciation permanent for property acquired after January 19, 2025. It created 100% expensing for qualified production property, but construction must begin before January 1, 2029. It ended the Section 179D energy-efficiency deduction for projects that begin construction after June 30, 2026 [17]. Those dates shape when owners pull the trigger.
Public buyers add one more wrinkle. They prefer fixed prices. Suppliers carry the fuel and tariff risk when contracts lack escalation clauses. In a year when diesel prices are up about 78% [12], that is not a rounding error.
Builder takeaway. Fix work-in-progress reporting, job costing and cash before the next leg of growth. Shorten quote validity and tie escalation to an index, not a conversation.
CM and design takeaway. Move owners from cost estimating to affordability modeling: three scope options against three rate environments, before the bond sale.
AI ecosystem takeaway. Pay for schedule certainty up front. It is cheaper than paying for delay later.
Owner takeaway. Refusing escalation clauses does not remove risk. It hides it in contingency. Put risk where it can be priced.
2027-2031 Forward Look. Bonds issued and backlogs signed now will still be live in the 2030s fiscal reset. Avoid strategies that need cheap money to work.
V. Power and Permission
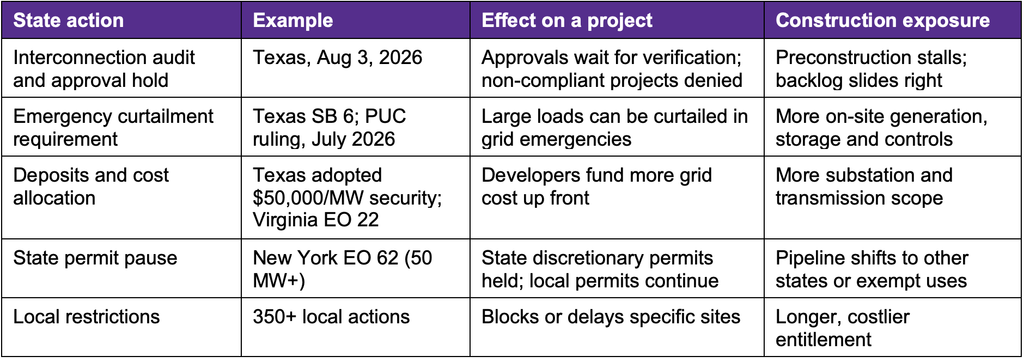
Power sets the pace. States now set the terms for getting it. Interconnection and permitting risk have become financial and scheduling risks, and the details matter. An audit is not a moratorium. A permit pause is not a denial. Each state is doing something different.
The grid is the critical path
Lawrence Berkeley National Laboratory projects data centers could use about 11.8% of U.S. electricity by 2030, within a scenario range of 9.5% to 15.3% [22]. That load is arriving faster than generation and transmission can be built.
Ratepayers already see it. In PJM, the largest U.S. grid operator, capacity prices in most zones jumped from $28.92 per megawatt-day for 2024/25 to $269.92 for 2025/26, about ninefold, then to the $329.17 price cap for 2026/27. The market monitor attributed 63% of the 2025/26 increase, about $9.3 billion, to data center demand [23]. When ratepayers pay, politicians notice.
Texas: conditions, curtailment and an audit
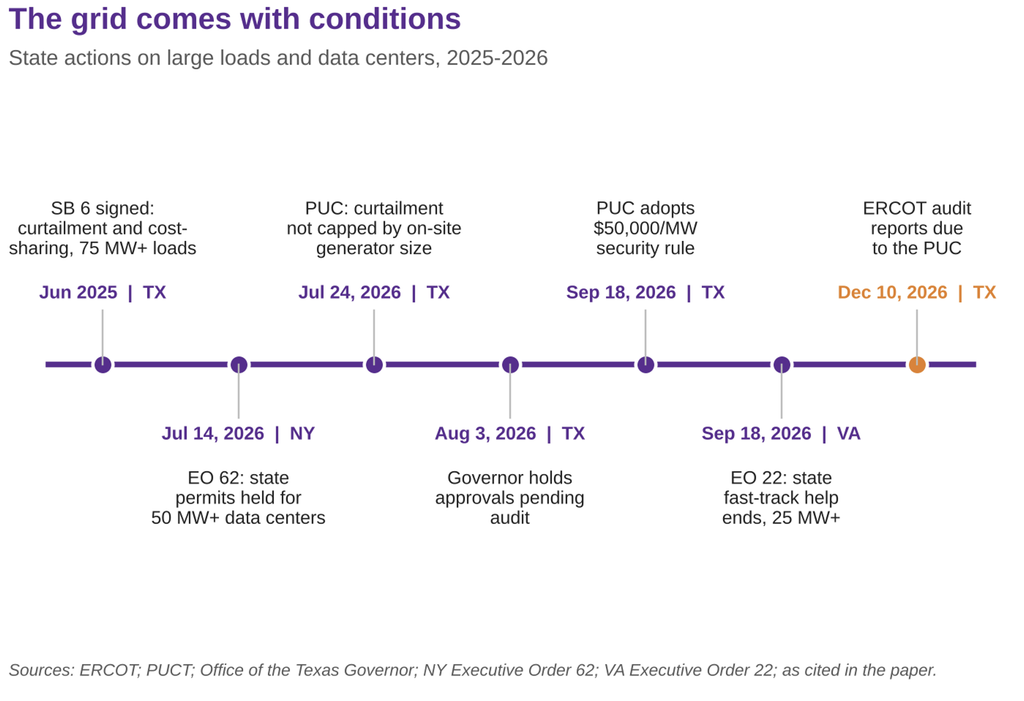
Texas is the largest data center construction market in the country, so its rules move the national numbers. Senate Bill 6, signed June 20, 2025, applies to loads of 75 megawatts or more in ERCOT. Large loads that interconnect after December 31, 2025 must be able to be curtailed during firm load-shed emergencies, and they carry more of their interconnection costs [25][54]. In July 2026 the Public Utility Commission ruled that emergency curtailment of a data center paired with its own generator is not capped by the size of that generator [26]. Rules the PUC adopted on September 18, 2026, effective October 8, require a $100,000 study fee and $50,000 per megawatt in financial security, about $50 million for a 1-gigawatt project, before construction costs and upgrade security [27][43].
Then came the audit. On August 3, 2026, Governor Greg Abbott directed the PUC and ERCOT to verify and audit every data center advancing through ERCOT’s interconnection process. He said no additional data centers could be approved to move forward until the audit is complete, and that projects failing state requirements must be denied connection [28]. Legal analysts describe it as an audit gate, not a moratorium [29]. ERCOT postponed its first large-load study classifications, and the PUC later allowed modified, conditional procedures. As of September, 362 large loads sat in the study cohort, and ERCOT is due to file its verification and community-impact reports by December 10, 2026 [30].
The 474 gigawatts of requests behind all this is requested load, not validated or probable energization [29]. The audit is partly a sorting machine. Mature, well-documented projects may move faster once speculative requests drop out.
New York and Virginia: a template and a tightening
New York is a small data center market. Its importance is as a political template. Executive Order 62, signed July 14, 2026, directs the Department of Environmental Conservation to hold in abeyance applications for any discretionary permit, approval or license to build or expand a data center that consumes or can consume 50 megawatts or more, unless the department had already deemed the application complete. Facilities used primarily for manufacturing, research, education or medical care are excluded. Local government permits are not affected. There is no fixed end date: the pause lasts until the state completes a generic environmental impact statement. The order also directs a beneficiary-pays interconnection working group and consideration of a New York Grid Acceleration Fund paid for by upfront data center contributions [31][35]. A separate bill covering facilities of 20 megawatts or more passed both houses in June 2026 but, as of October, had not been delivered to the governor [32].
Virginia is the No. 2 construction market. On September 18, 2026, Governor Abigail Spanberger’s Executive Order 22 ended discretionary state help, such as expedited permitting, for new projects of 25 megawatts or more. It ordered work on cost allocation, curtailment, water, noise and backup generators. It is not a moratorium, and it does not change local zoning [33]. But the second-largest market is tightening too.
Locally, the pressure is broader still. One tracker counts 506 active restrictions on data centers across 46 states as of October 6, more than 350 of them local [34]. In the second quarter of 2026 alone, local opposition blocked or delayed 45 projects worth about $68 billion [36]. In a June Reuters/Ipsos poll, only one in three Americans said building data centers at a rapid pace is mainly a good thing [37].
Scarcity is regional, not universal
National averages hide where the constraints actually bind. A shortage of mission-critical electricians or interconnection capacity in one metro does not mean a national shortage. The question is not whether the United States has enough construction capacity. It is whether the right capacity exists in the right place at the right time. The most useful map in this cycle overlays data center construction, power availability, interconnection risk, state and local permitting actions, and skilled-labor conditions. Where all five line up, projects move. Where one fails, the funnel stalls.
The constraints also create work. If a grid operator can curtail a data center in an emergency, that data center needs to ride through it: on-site generation, batteries, load-shedding controls and backup water. The brake on grid access is an accelerator for behind-the-meter construction.
Builder takeaway. Map backlog by state and by permission status. Add change-in-law and interconnection-delay language to contracts. Build a ride-through package of generation, storage and controls as a service line.
CM and design takeaway. Add “connectable” to funded, powered and permitted, and track it as a schedule milestone. Offer audit readiness as a service.
AI ecosystem takeaway. Underwrite political and grid risk like weather risk. Diversify across states and grids, design for curtailment, and bring a ratepayer benefit story that a governor can sell.
Policymaker takeaway. Clear, dated rules protect ratepayers without stranding projects and crews already underway.
2027-2031 Forward Look. Expect Texas-style conditions, including deposits, curtailment and cost allocation, to spread to most growth states by 2028. Full moratoria stay the exception, but every statehouse debate now starts with who pays.
VI. Parts: The Supply Chain Bottleneck
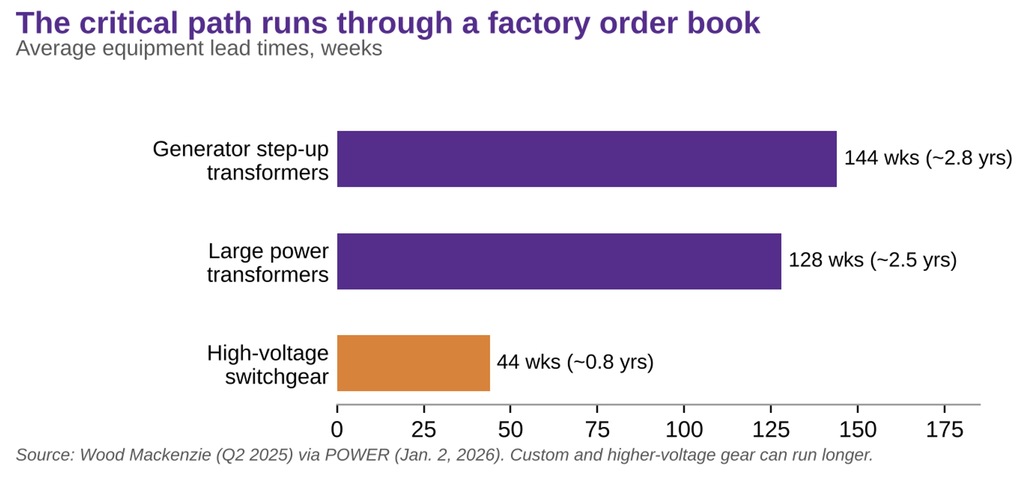
Price you can pass through. Allocation stops a crew. In this cycle the critical path increasingly runs through a factory order book, not the jobsite.
Large power transformers averaged about 128 weeks, roughly two and a half years, in Wood Mackenzie’s survey. Generator step-up transformers averaged about 144 weeks. High-voltage switchgear averaged about 44 weeks, and custom or higher-voltage gear runs longer [56]. That turns a design decision into a schedule decision. Choose the equipment class late and the project waits. Every data center, factory, hospital and treatment plant competes for the same gear.
Tariffs changed shape in 2026. The Supreme Court struck down tariffs imposed under the International Emergency Economic Powers Act on February 20 [40]. Exposure went up anyway. From April 6, Section 232 duties apply to the full customs value of covered goods: 50% on articles made almost entirely of steel, aluminum or copper, and 25% on derivative products, with an exception for derivatives whose metal content is under 15% by weight. Certain steel and aluminum grid and industrial equipment pays a reduced rate of at least 15% until January 1, 2028, when it steps up to 25% [39]. Mark that date on every procurement calendar.
Prices are moving accordingly. In August, inputs to construction were up 8.8% from a year earlier. Steel mill products were up 23.4%, copper and brass mill shapes 20.9%, and diesel 77.8% [12]. The war-driven disruption of shipping through the Strait of Hormuz since early March 2026 sits behind the energy numbers [42]. Owens Corning expects the Iran conflict to cost it a net $40 million in the third quarter alone, after $30 million in the second [20].
Materials beyond the electrical room are tight too. Turkey supplied about 32% of U.S. cement and clinker imports from 2021 to 2024 [41]. Across the industries in our field research, the same pattern repeated: big buyers reserve scarce supply early, smaller contractors get what is left, and the job stops for the one item nobody ordered in time.
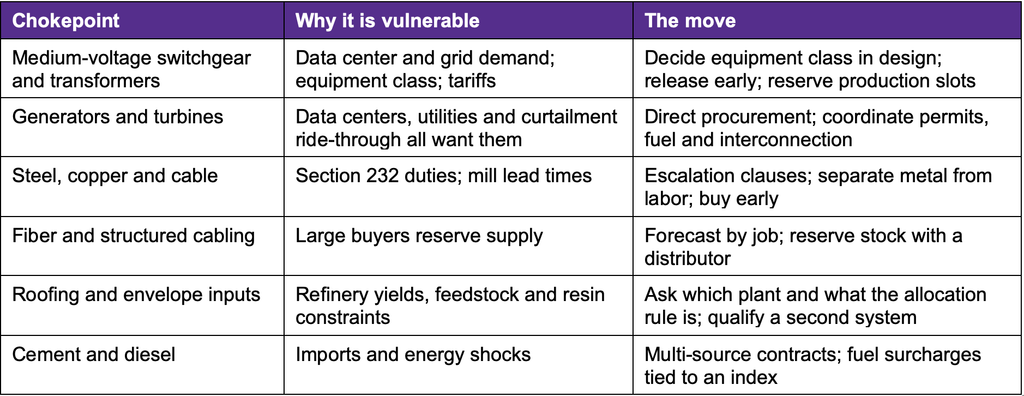
Builder takeaway. Make procurement a competitive weapon: forecast earlier, standardize, qualify two sources, reserve slots and shorten quote validity. The best question to ask a supplier is not when it ships. It is which plant it ships from and what the allocation rule is.
CM and design takeaway. Launch long-lead procurement as a priced service. Ask about equipment class in design, not at buyout.
AI ecosystem takeaway. Standardize electrical and mechanical specifications across campuses. Repeatable designs win factory slots and let gear move between sites.
2027-2031 Forward Look. Gear scarcity persists through the build window, and the January 1, 2028 tariff step-up adds a pricing cliff. Firms that reserve capacity early set the schedule for everyone else.
VII. People: The Workforce Constraint
Labor is structural, not cyclical. It is also local. Growth equals productivity times population growth, and population growth is slowing fast.
Associated Builders and Contractors estimates construction needs about 349,000 net new workers in 2026 and about 456,000 in 2027 [44]. The Bureau of Labor Statistics projects electrician employment to grow 9% from 2025 to 2035, with about 72,700 openings a year [45]. Unemployment among workers with recent construction experience hit a record-low 3.1% in August 2026 (not seasonally adjusted) and was 3.5% in September, down from 3.8% a year earlier [7][46]. There is no bench.
The pipeline is narrowing. The Census Bureau reports net international migration fell from 2.7 million to 1.3 million in the year to July 1, 2025, a 53.8% drop, and population growth slowed to 0.5% [47]. The construction workforce is aging out at the same time. That is a two-sided squeeze.
The broader job market is lopsided too. In the 12 months to July 2026, health care added about 392,000 jobs while the rest of the economy lost about 76,000 [48]. Construction is competing for workers in an economy where one sector does most of the hiring.
In our field research, labor was a constraint in every industry, but the binding trade differed by seat: electricians, roofers working in extreme heat, licensed mixer-truck drivers, cabling installers and designers, and retiring utility and procurement staff. The data center wage premium pulls scarce craft labor toward hyperscale campuses whether or not a contractor bids that work. A roofer losing crews in a slow market is not necessarily losing them to another roofer.
The answer is productivity, not headcount. Prefabrication, standardized assemblies, labor-efficient systems and training raise output per skilled worker. Every hour of installation labor removed from a system is worth more each year the shortage lasts.
Builder takeaway. Retention beats recruiting. Treat apprenticeships and foreman development as growth infrastructure. Bid on installed cost, not material cost.
CM and design takeaway. Buy or build one named technical specialty rather than general capacity.
AI ecosystem takeaway. Fund workforce pipelines where you build. The crew shortage is your schedule risk, not just the contractor’s.
2027-2031 Forward Look. The labor gap persists through 2030 regardless of demand. Growth goes to the firms that raise output per person, in the metros where the work actually is.
VIII. Policy and the Construction Map
Federal policy is pulling asset classes in different directions on different deadlines. States are running their own clock for data centers. Policy is an operating variable, not background noise. This section reports consequences, not verdicts.
Tariffs as a construction program
Section 232 is now being used to build plants, not just to protect them. The pharmaceutical tariff structure sets a 100% default rate, 15% for the European Union, Japan, South Korea and Switzerland, and 10% for the United Kingdom. Companies with an approved onshoring plan pay 20% until April 2, 2030. Companies with an onshoring plan and a most-favored-nation pricing agreement pay zero through January 20, 2029. The tariffs took effect July 31 for 17 named companies and September 29 for everyone else [49].
The construction attached to it is large but messy. Headline pharmaceutical pledges add up to roughly half a trillion dollars [62], though they mix plants with research spending and overlap in time. Eli Lilly alone said it would spend at least $27 billion to build four U.S. plants [50]. Commerce Secretary Howard Lutnick said in early September that chip tariff relief will follow the pharmaceutical model, tied to domestic manufacturing; rates and dates have not been announced, beyond a 25% tariff on certain advanced chips imposed in January [51][63]. Critical minerals went the other way: a January 2026 proclamation chose negotiations, with tariffs held in reserve [52].
The discipline is the same one this paper applies to data centers. Track land purchases, permits and contract awards, not pledges.
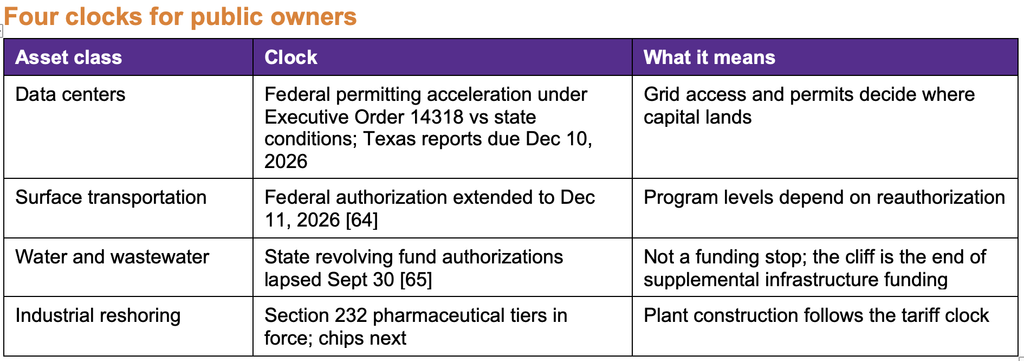
Public buyers are changing how they buy as well. With fewer procurement staff and tighter budgets, agencies lean on cooperative contracts and multi-year agreements. Special districts that run on rates and fees, such as water, utility, transit and fire, tend to be steadier buyers than grant-dependent agencies.
Elections matter at every level. The November 3, 2026 state and local races shape siting, codes and utility rules. The 2027 legislative sessions, including Texas in January, will revisit large-load rules. The 2028 election shapes trade, energy and permitting. Prepare for policy regimes. Don’t root for parties.
Builder takeaway. Map every federal and state action to actual scope. Separate announcements from funded, connectable work.
Policymaker takeaway. Pair modernization funding with delivery reform and workforce funding. Money without builders is a press release.
2027-2031 Forward Look. The 2028 tariff step-up and election calendar set the tempo. Firms with a live policy map move first when windows open.
IX. AI: Building More With Less
AI won’t pull wire. But it can give time back to the people who manage the people who do.
The strongest supported claim is narrow and valuable: AI reduces administrative work in estimating, document management, procurement and project controls. The bigger claims need evidence. It helps to separate three levels.
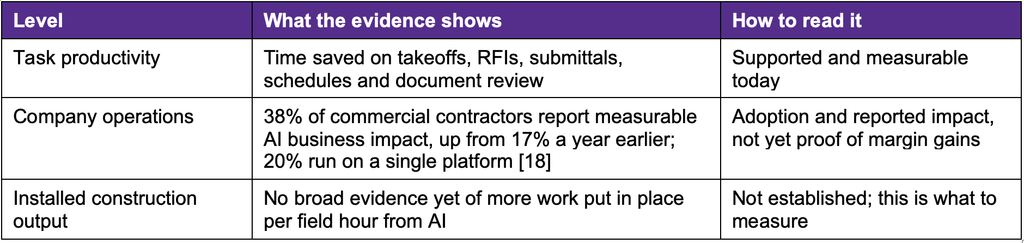
The early uses are practical. In ServiceTitan’s survey, 24% of commercial contractors apply AI to cost estimation and 22% to bid management [18]. In our field research, the first uses were warranty and intake forms, labor tracking, estimating support, dispatch and fleet routing, design and code navigation, and procurement governance. Very little touched field installation.
The AI asymmetry
Here is the part most contractors miss: their counterparties are already instrumented. QXO’s chief executive said the building products distribution industry is way behind on tech. QXO said it found about $200 million in pricing leakage at one acquired distributor from undisciplined manual discounting, and it plans to win share by being in stock rather than by cutting price [21]. Owens Corning deployed an AI model in roofing that flags changes in customer purchase patterns so its sales team can act earlier [20].
Read that as a contractor. Your distributor has an elasticity model. Your manufacturer is watching your purchase patterns. The question is whether you show up to the negotiation with numbers or with a feeling.
The multi-site manager: a hypothesis to test
Some construction leaders believe AI could let one project executive oversee several sites instead of one. That would be a large capacity gain in a labor-short market. It is a hypothesis, not a result. Test it with metrics: sites per manager, RFI cycle time, rework, safety incidents and schedule variance. Then decide whether to price it into fees.
The open question is accountability. When an AI agent approves the wrong submittal, who signs for it? Write that policy before an owner or a court writes it for you.
Builder takeaway. Start with one high-volume office workflow. Measure hours, cycle time and error rate. Keep people on safety, contracts and pricing.
CM and design takeaway. Pilot the multi-site model with explicit metrics before selling it as fee leverage.
AI ecosystem takeaway. Construction is a large, underserved market for agentic tools. Products win by plugging into systems of record and answering the liability question.
2027-2031 Forward Look. By 2030 the question is not whether a firm uses AI. It is whether it can show what the AI did, what it saved and who signed for it.
X. Growth Opportunities, 2027-2031
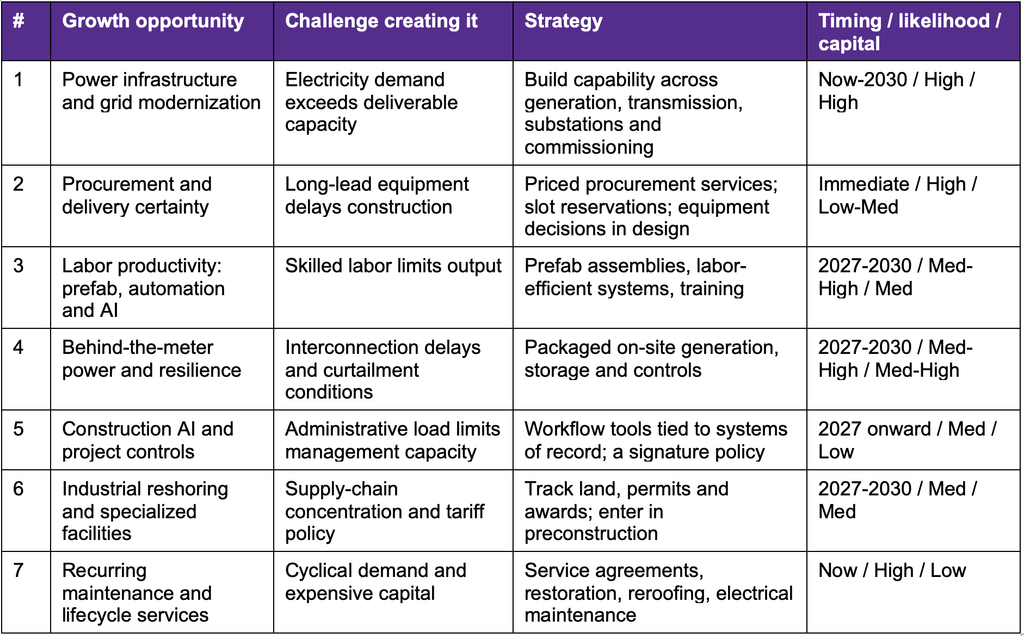
Every constraint in this paper is also a market. The seven opportunities below are ranked by the author’s judgment of size, durability and fit with the five constraints. It is an editorial prioritization, not a quantitative forecast. Each follows the same logic: a challenge creates an impact, the impact calls for a strategy, and the strategy opens a growth opportunity.
The early uses are practical. In ServiceTitan’s survey, 24% of commercial contractors apply AI to cost estimation and 22% to bid management [18]. In our field research, the first uses were warranty and intake forms, labor tracking, estimating support, dispatch and fleet routing, design and code navigation, and procurement governance. Very little touched field installation.
The AI asymmetry
Here is the part most contractors miss: their counterparties are already instrumented. QXO’s chief executive said the building products distribution industry is way behind on tech. QXO said it found about $200 million in pricing leakage at one acquired distributor from undisciplined manual discounting, and it plans to win share by being in stock rather than by cutting price [21]. Owens Corning deployed an AI model in roofing that flags changes in customer purchase patterns so its sales team can act earlier [20].
Read that as a contractor. Your distributor has an elasticity model. Your manufacturer is watching your purchase patterns. The question is whether you show up to the negotiation with numbers or with a feeling.
The multi-site manager: a hypothesis to test
Some construction leaders believe AI could let one project executive oversee several sites instead of one. That would be a large capacity gain in a labor-short market. It is a hypothesis, not a result. Test it with metrics: sites per manager, RFI cycle time, rework, safety incidents and schedule variance. Then decide whether to price it into fees.
The open question is accountability. When an AI agent approves the wrong submittal, who signs for it? Write that policy before an owner or a court writes it for you.
Builder takeaway. Start with one high-volume office workflow. Measure hours, cycle time and error rate. Keep people on safety, contracts and pricing.
CM and design takeaway. Pilot the multi-site model with explicit metrics before selling it as fee leverage.
AI ecosystem takeaway. Construction is a large, underserved market for agentic tools. Products win by plugging into systems of record and answering the liability question.
2027-2031 Forward Look. By 2030 the question is not whether a firm uses AI. It is whether it can show what the AI did, what it saved and who signed for it.
X. Growth Opportunities, 2027-2031
Every constraint in this paper is also a market. The seven opportunities below are ranked by the author’s judgment of size, durability and fit with the five constraints. It is an editorial prioritization, not a quantitative forecast. Each follows the same logic: a challenge creates an impact, the impact calls for a strategy, and the strategy opens a growth opportunity.
XI. Scenarios and Action Framework
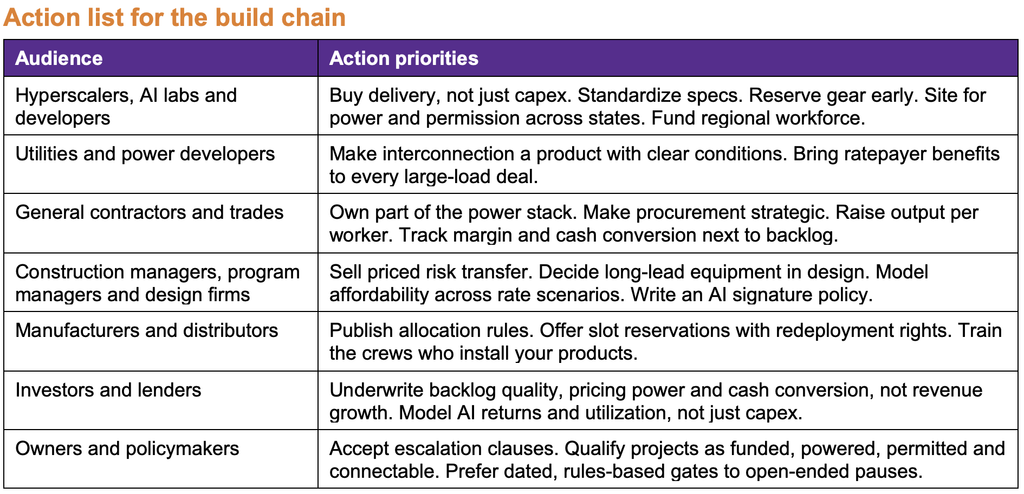
The through-line is that the variables construction once treated as fixed moved at the same time: cheap money, available gear, available people, a predictable grid connection and one federal clock. Then the biggest customer in a century showed up asking for speed. AI runs at chip speed. It gets built at construction speed.
Decision-makers should hold three scenarios in view.
- Base case, Better Not Easy. Nonresidential construction reaccelerates modestly in 2027. AI capex keeps rising. Rates stay elevated. Labor and gear stay tight. The Texas audit clears with tougher terms, and mature projects move while speculative requests drop out.
- Upside. AI revenue and utilization grow fast enough to support the build. States converge on clear, predictable rules. Domestic equipment capacity arrives. Non-data-center construction recovers in 2027.
- Downside. AI returns lag the build. Utilization disappoints and financing tightens. Capex pauses in some markets while others stay power-constrained. Long rates stay above 5%, state conditions spread and public owners defer. The narrow boom gets narrower.
Stress test for every firm. What share of revenue, margin and crews sits in data centers, with which customers, in which states? If that lane fell by a third, which crews, gear orders and credit lines would you be holding? The firms that answer this now buy assets in a correction instead of selling them.
Questions every stakeholder should ask
- Which of our projects are financed, powered, permitted, equipped and staffed, and which are only announced?
- Can our customer’s AI revenue support the capacity it is ordering?
- Where is our backlog growing faster than our margin and cash?
- If a state changed our grid terms tomorrow, which projects would stop, and who would pay for the wait?
- Which plant is our critical material coming from, and what is the allocation rule?
- Where can AI make our team faster, and who signs for its work?
The next phase of AI growth will not be determined by technological capability alone. It will be determined by how efficiently the physical economy converts investment into productive capacity.
Selected Sources and Notes
[1] Brookings Institution model by Stijn Van Nieuwerburgh (Columbia Business School), reported by The Wall Street Journal, Sept. 2026: $10.3T U.S. AI infrastructure investment 2025-2032, ~3.63% of GDP a year. Coverage: https://cryptobriefing.com/brookings-ai-infrastructure-10-trillion-2032/
[2] Coverage of the Brookings model: scope (data centers, chips, networks, energy; adjusted for projects unlikely to be built) and implied AI services revenue of ~$3.5T a year by 2032. https://ecosistemastartup.com/brookings-eeuu-necesita-gastar-el-9-de-su-pib-en-ia/
[3] CRE Daily, “$10.3T Data Center Buildout Reshapes US Economy,” Sept. 25, 2026: railroads 2.24% and highways 1.13% of GDP; Goldman Sachs AI investment ~1.9% of GDP in 2026. https://www.credaily.com/?p=223174
[4] The Motley Fool, Aug. 3, 2026: 2026 capex guidance for Microsoft, Amazon, Alphabet and Meta. https://www.fool.com/investing/2026/08/03/microsoft-and-amazon-won-the-ai-spending-week/
[5] News Tribune, July 10, 2026: Micron raises U.S. investment plan to ~$250B. https://www.newstribune.com/news/2026/jul/10/micron-boosts-us-spending-to-250-billion-to-feed/
[6] DatacenterDynamics, March 2025: TD Cowen reports Microsoft canceled up to 2 GW of data center projects. https://datacenterdynamics.com/en/news/microsoft-cancels-up-to-2gw-of-data-center-projects-says-td-cowen
[7] AGC Data DIGest, Oct. 2, 2026: August construction spending (total -1.7% y/y; private nonresidential -1.0%; all other private nonresidential -5.9%; public +2.5%) and September jobs (unemployment 3.5% for workers with recent construction experience). https://www.agc.org/sites/default/files/Files/Communications/datadigest20261002.pdf
[8] KPMG, August 2026 construction spending: data center spending a record $85B annual rate, up 73.2% y/y (Census). https://kpmg.com/us/en/articles/2026/august-2026-construction-spending.html
[9] U.S. Census Bureau, Construction Spending, August 2026 release (Oct. 1, 2026). https://www.census.gov/construction/c30/current/index.html
[10] ConstructConnect, October 2026 Data Center Report: $98.5B of data center starts through August 2026; 24% of nonresidential building starts; average project $1.18B vs $507.4M in 2025. https://news.constructconnect.com/october-2026-data-center-report-spending-reaches-98.5-billion-ytd-construction-costs-rise
[11] American Institute of Architects, Consensus Construction Forecast, July 21, 2026. https://www.aia.org/about-aia/press/uneven-growth-persists-across-nonresidential-construction-economic-uncertainty
[12] BLS Producer Price Index via AGC, August 2026: inputs to construction, diesel, steel mill products, copper and brass mill shapes. https://www.agc.org/sites/default/files/users/user21902/PPI%20Tables%202026_08.pdf
[13] Federal Open Market Committee decision, Sept. 16, 2026 (coverage). https://investinglive.com/central-banks/fomc-rate-decision-fed-hikes-for-the-first-time-in-three-years/
[14] 10-year Treasury constant maturity rate, Sept.-Oct. 2026. Latest: 5.24% on Oct. 9, 2026. https://ycharts.com/indicators/10_year_treasury_rate
[15] Committee for a Responsible Federal Budget on CBO’s February 2026 Budget and Economic Outlook. https://www.crfb.org/papers/cbos-february-2026-budget-and-economic-outlook
[16] Raymond James Weekly Rate Monitor, Oct. 5, 2026: AAA 30-year municipal yield 5.11%. Debt-service comparison is author analysis assuming 30-year level annual payments. https://www.raymondjames.com/-/media/rj/dotcom/files/wealth-management/market-commentary-and-insights/bond-market-commentary/weekly_rate_monitor.pdf
[17] Baker Tilly, One Big Beautiful Bill Act tax provisions: 179D termination, qualified production property, bonus depreciation. https://www.bakertilly.com/insights/tax-and-spending-updates
[18] ServiceTitan, 2026 Commercial Specialty Contractor Industry Report. https://www.servicetitan.com/press/servicetitan-report-finds-ai-adoption-more-than-doubles-among-commercial
[19] Carlisle Companies Q2 2026 earnings call, July 29, 2026 (transcript). https://www.webull.com/news/15364422543107072
[20] Owens Corning Q2 2026 earnings call, Aug. 5, 2026. https://s21.q4cdn.com/855213745/files/doc_financials/2026/q2/Owens-Corning-Q2-2026-Earnings-Call-Aug-05-2026.pdf
[21] Roofing Contractor, “How QXO Is Using AI to Streamline Distribution,” Sept. 17, 2025. https://www.roofingcontractor.com/articles/101320-how-qxo-is-using-ai-to-streamline-distribution
[22] Lawrence Berkeley National Laboratory, United States Data Center Energy Usage Report: 2025 Update. https://eta-publications.lbl.gov/publications/united-states-data-center-energy-2025
[23] IEEFA, “Projected data center growth spurs PJM capacity prices by factor of 10” (Monitoring Analytics attribution). https://ieefa.org/resources/projected-data-center-growth-spurs-pjm-capacity-prices-factor-10
[24] EPRI, Utility Experiences and Trends Regarding Data Centers: 2024 Survey. https://restservice.epri.com/publicdownload/000000003002030643/0/Product
[25] ERCOT, “Grid Reliability, Data Centers, and Net-Metering Arrangements,” June 1, 2026 (Senate Bill 6). https://www.ercot.com/files/docs/2026/06/01/ERCOT-Trending-Topic-Grid-Reliability-Data-Centers-Net-Metering-Arrangements.pdf
[26] White & Case, PUCT curtailment authority over co-located data centers (Docket 59220). https://www.whitecase.com/insight-alert/puct-affirms-curtailment-authority-over-co-located-data-centers-first-net-metering
[27] Utility Dive, Sept. 21, 2026: PUCT adopts large-load interconnection rule (Project 58481, 16 TAC 25.194), effective Oct. 8, 2026. https://utilitydive.com/news/texas-puc-adopts-data-center-interconnection-rules/830899
[28] E&E News, Aug. 2026: Texas governor puts data center grid approvals on hold; ERCOT request volume. https://www.eenews.net/articles/texas-governor-puts-data-center-grid-approvals-on-hold/
[29] Gibson Dunn, What Governor Abbott’s Data Center Audit Directive Means for ERCOT and the Batch Zero Study Process. https://www.gibsondunn.com/what-governor-abbotts-data-center-audit-directive-means-for-ercot-and-the-batch-zero-study-process/
[30] ERCOT, Batch Zero Update, Sept. 11, 2026. https://www.ercot.com/files/docs/2026/09/11/14-Batch-Zero-Update.pdf
[31] New York State Executive Order No. 62, July 14, 2026. https://www.governor.ny.gov/executive-order/no-62-establishing-temporary-moratorium-data-centers-new-york-while-state-develops
[32] Davis Polk, New York State Enacts Data Center Moratorium (legislative bill and NYISO queue). https://www.davispolk.com/insights/client-update/new-york-state-enacts-data-center-moratorium
[33] Venable, Virginia Governor Issues Executive Order on Data Center Development, Sept. 2026. https://www.venable.com/insights/publications/2026/09/virginia-governor-issues-executive-order
[34] ElectricChoice, Data Center Moratoriums tracker (as of Oct. 6, 2026). https://www.electricchoice.com/datacenters/moratoriums/
[35] Jones Day, New York Enacts First Statewide Data Center Moratorium, July 2026. https://www.jonesday.com/de/insights/2026/07/new-york-enacts-first-statewide-data-center-moratorium
[36] Data Center Watch, Q2 2026: 45 projects worth $68B blocked or delayed (coverage). https://aiweekly.co/alerts/data-center-watch-45-us-ai-data-center-projects-worth-68b-blocked-or-delayed-in
[37] Reuters, June 11, 2026: Americans wary of AI-driven data center boom, Reuters/Ipsos poll shows. https://wsau.com/2026/06/11/americans-wary-of-ai-driven-data-center-boom-reuters-ipsos-poll-shows/
[38] Visual Capitalist, Mapped: America’s Data Center Construction Boom, Mar. 31, 2026, based on Aterio data as of March 2026. https://www.visualcapitalist.com/mapped-americas-data-center-construction-boom/
[39] White & Case, United States Modifies Steel, Aluminum and Copper Section 232 Tariffs (effective Apr. 6, 2026). https://www.whitecase.com/insight-alert/united-states-modifies-steel-aluminum-and-copper-section-232-tariffs
[40] Jones Day, United States Supreme Court Invalidates IEEPA Tariffs, Feb. 2026. https://www.jonesday.com/de/insights/2026/02/united-states-supreme-court-invalidates-ieepa-tariffs
[41] U.S. Geological Survey, Mineral Commodity Summaries 2026: Cement. https://pubs.usgs.gov/periodicals/mcs2026/mcs2026-cement.pdf
[42] Congressional Research Service, Iran Conflict and the Strait of Hormuz: Impacts on Oil, Gas, and Other Commodities, March 11, 2026. https://www.everycrsreport.com/files/2026-03-11_R45281_70874465f4435fd92357ac85f4af8f89300419a0.html
[43] Colocation Scout: Texas PUC large-load interconnection rule final terms ($100,000 study fee; $50,000/MW security; adopted Sept. 18, effective Oct. 8, 2026). https://colocationscout.com/news-texas-puc-large-load-interconnection-rule.html
[44] Construction Dive, Jan. 28, 2026: ABC workforce shortage estimates for 2026 and 2027. https://www.constructiondive.com/news/labor-demand-gap-shrinks-abc-construction-staff/810681/
[45] U.S. Bureau of Labor Statistics, Occupational Outlook Handbook: Electricians. https://www.bls.gov/ooh/Construction-and-Extraction/Electricians.htm
[46] ColoradoBiz, Sept. 2026: construction unemployment a record-low 3.1% in August. https://coloradobiz.com/us-construction-adds-22000-jobs-unemployment-falls-31/
[47] U.S. Census Bureau, Vintage 2025 population estimates, Jan. 27, 2026. https://census.gov/newsroom/press-releases/2026/population-growth-slows.html
[48] Altarum, Health Sector Economic Indicators Labor Brief, August 2026 (BLS data through July 2026). https://altarum.org/sites/default/files/HSEI-Labor-Brief_August_2026.pdf
[49] TariffLens, Section 232 pharmaceutical tariffs 2026 https://www.tarifflens.ai/blog/section-232-pharmaceutical-tariffs-2026
[50] Reuters factbox via Oman Observer, Jan. 30, 2026: drugmakers’ U.S. investment pledges. https://www.omanobserver.om/article/1183559/business/economy/drugmakers-rush-to-boost-us-presence-as-tariff-threat-looms
[51] The Korea Times, Sept. 3, 2026: Lutnick on semiconductor tariff policy. https://koreatimes.co.kr/world/20260903/lutnick-trump-govt-considering-targeted-thoughtful-tariff-policy-for-semiconductors
[52] White & Case, President Trump Orders Critical Minerals Trade Negotiations in Section 232 Action, Jan. 2026. https://www.whitecase.com/insight-alert/president-trump-orders-critical-minerals-trade-negotiations-section-232-action
[53] US Data Center Map (dcmap.us), facilities by stage, updated Oct. 2026 (alternative tracker). https://dcmap.us
[54] Pillsbury, Texas SB 6: transmission fees, interconnection standards for large load customers and co-located loads. https://www.pillsburylaw.com/en/news-and-insights/texas-sb6-transmission-fees-interconnected-standards-large-load-customers-colocated-loads.html
[55] Utility Dive, Aug. 5, 2026: Texas hits pause on data center interconnections (474 GW, more than 5x record peak, ~90% data centers). https://www.utilitydive.com/news/texas-hits-pause-data-center-interconnections/827046/
[56] POWER, Jan. 2, 2026, citing Wood Mackenzie (Q2 2025): transformer and switchgear lead times. https://www.powermag.com/transformers-in-2026-shortage-scramble-or-self-inflicted-crisis
[57] The Bond Buyer, Oct. 2021: Refinitiv MMD AAA 30-year municipal yield 1.69% (Oct. 8, 2021). https://www.bondbuyer.com/news/10-year-aaa-muni-yield-hits-high-of-2021
[58] OpenAI, Announcing The Stargate Project, Jan. 21, 2025. https://openai.com/index/announcing-the-stargate-project/
[59] Apple Newsroom, Aug. 6, 2025: U.S. commitment increased to $600 billion. https://www.apple.com/newsroom/2025/08/apple-increases-us-commitment-to-600-billion-usd-announces-ambitious-program/
[60] NVIDIA, Apr. 14, 2025: up to half a trillion dollars of AI infrastructure produced in the U.S. https://blogs.nvidia.com/blog/nvidia-manufacture-american-made-ai-supercomputers-us/
[61] Reuters via MarketScreener, Nov. 2025: Meta plans $600 billion U.S. spend through 2028. https://www.marketscreener.com/news/meta-plans-600-billion-us-spend-as-ai-data-centers-expand-ce7d5fdade8bff21
[62] Reuters factbox via BNN Bloomberg, Aug. 10, 2026: global drugmakers announce roughly $500 billion of U.S. investment. https://www.bnnbloomberg.ca/business/2026/08/10/global-drugmakers-invest-billions-to-boost-us-presence/
[63] The White House, Jan. 2026 fact sheet: Section 232 action on certain advanced computing chips. https://www.whitehouse.gov/fact-sheets/2026/01/fact-sheet-president-donald-j-trump-takes-action-on-certain-advanced-computing-chips-to-protect-americas-economic-and-national-security
[64] AASHTO Journal, Sept. 2026: surface transportation authorization extended to Dec. 11, 2026. https://aashtojournal.transportation.org/?p=41360[65] NACo, Sept. 2026: letter urging reauthorization of the Clean Water and Drinking Water State Revolving Funds. https://www.naco.org/news/naco-sends-letter-urging-reauthorization-clean-water-and-drinking-water-state-revolving-funds
[65] NACo, Sept. 2026: letter urging reauthorization of the Clean Water and Drinking Water State Revolving Funds. https://www.naco.org/news/naco-sends-letter-urging-reauthorization-clean-water-and-drinking-water-state-revolving-funds
[66] SemiAnalysis, “Stop Saying Half of 2026 US Datacenter Capacity Is Canceled,” June 18, 2026: delays cluster in early-stage announced projects; grid connection lead times of 7-10 years in several metros. https://newsletter.semianalysis.com/p/stop-saying-half-of-2026-us-datacenter
[67] Utility Dive, Sept. 23, 2026: Efforts to curb data center speculation gain ground across the US (PUCT Chairman Thomas Gleeson: “A lot of it is speculative”). https://www.utilitydive.com/news/efforts-to-curb-data-center-speculation-gain-ground-across-the-us/830495/
[68] CBRE, North America Data Center Trends H1 2026, Aug. 27, 2026: primary market vacancy 1.4%; 80.4% of under-construction capacity preleased vs 74.3% a year earlier; power availability most decisive in site selection. https://www.cbre.com/insights/books/north-america-data-center-trends-h1-2026
[69] Data Center Knowledge (Bloomberg), Nov. 10, 2025: Data centers in Nvidia’s hometown stand empty awaiting power; Silicon Valley Power upgrade expected in 2028. https://www.datacenterknowledge.com/energy-power-supply/data-centers-in-nvidia-s-hometown-stand-empty-awaiting-power