The United States has long been known for its rapidly growing population, with many economic and social opportunities stemming from this growth. However, recent years have seen a significant shift in this trend, with population growth nearly flatlining and even collapsing in some regions. This article will explore the current state of U.S. population dynamics, including trends and demographics both before and during the pandemic. Additionally, we will delve into the underlying causes of this collapse and what it means for the future of the U.S. economy. Finally, we will look ahead to 2050 and discuss potential solutions for mitigating this population decline.
Without excessive fiscal or monetary stimulus, the United States has a slow growth problem. Stronger economic growth is key for supporting US debt, for making Social Security and Medicare solvent and for creating prosperity for all Americans. Understanding the underlying US demographics is critical for understanding what solutions will help achieve strong growth. As an economic futurist, I find it’s critical to understand US population trends for the farthest view into what growth opportunities will present themselves decades from today.
Population Trends and Demographics Prior to the Pandemic
Prior to the pandemic, the U.S. population has been steadily increasing, although at a continuously declining rate. According to estimates by the United Nations, the total U.S. population increased almost two-fold between January of 1960 and 2020, from 174.7 million to 335.4 million (Figure 1, blue line). However, the pace of population growth has been falling in recent years. U.S. population growth averaged 1.18% between 1961 and 1993, when it reached its most recent peak of 1.47%. The growth rate has been declining since then, reaching 0.64% at the start of 2020, with an average of 1.12% during 1994-2009 and an average of 0.80% during 2010-2019 (Figure 1, green bars).
Figure 1 – Total U.S. Population, Jan 1960 – Jan 2019, Millions
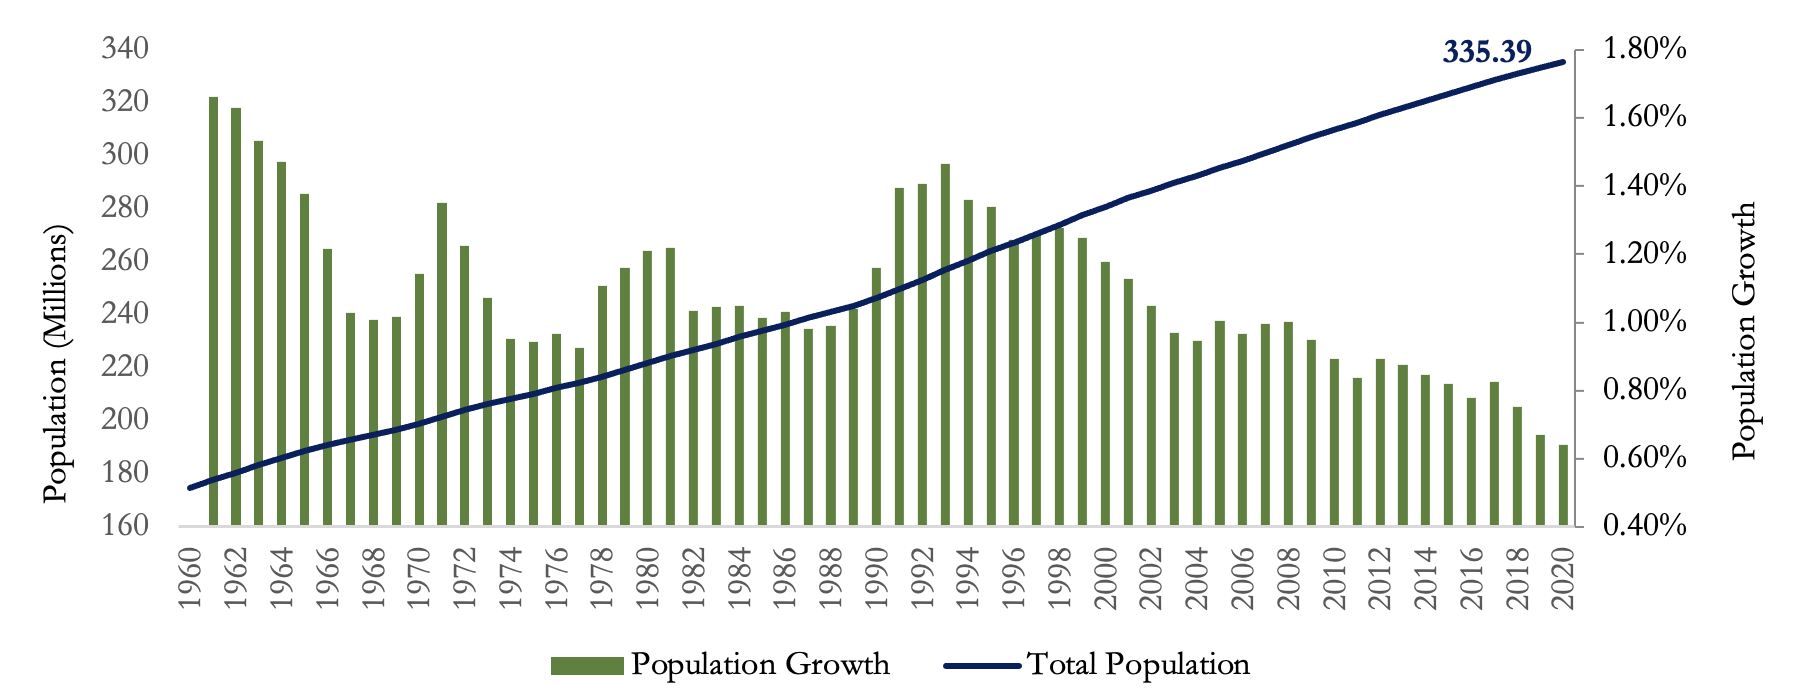
Source: United Nations 2022 World Population Prospects.
This slowdown in population growth has been driven by both, a declining birth rate and a rapidly increasing death rate. As shown in Figure 2 below, the number of U.S. births dropped by 9.2% from 4.14 million in 1990 to 3.75 million in 2019. At the same time, the number of deaths dramatically rose by 30.7%, from 2.12 million to 2.78 million, during the same period.
Figure 2 – Number of Birth and Deaths in the U.S., 1990-2019, Millions
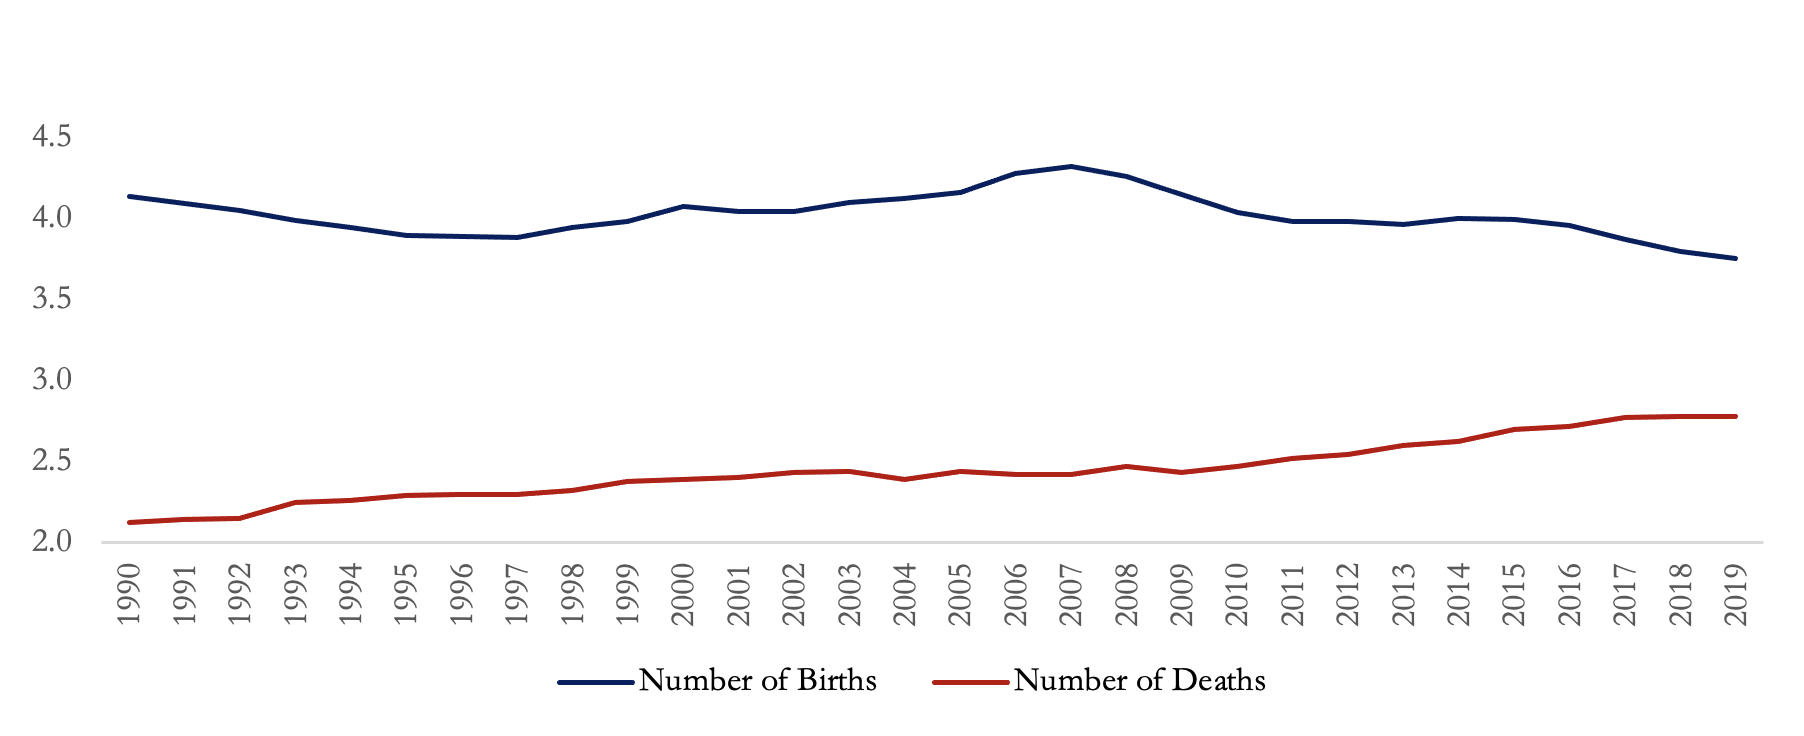
Source: United Nations 2022 World Population Prospects.
Despite the falling number of births and increasing deaths, the natural population change, defined as the difference between births and deaths in a given year, remained positive. The total number of births continued to surpass deaths, although with an increasingly narrowing gap. Moreover, as shown in Figure 3, positive and high net migration has been a critical factor fueling population growth in the U.S. In 2019, both the net migration and natural change rates were responsible for the population increase as they were both positive at 3.5 and 2.9 per 1000, respectively.
Figure 3 – Population Change by Component, 1961-2019, per 1000
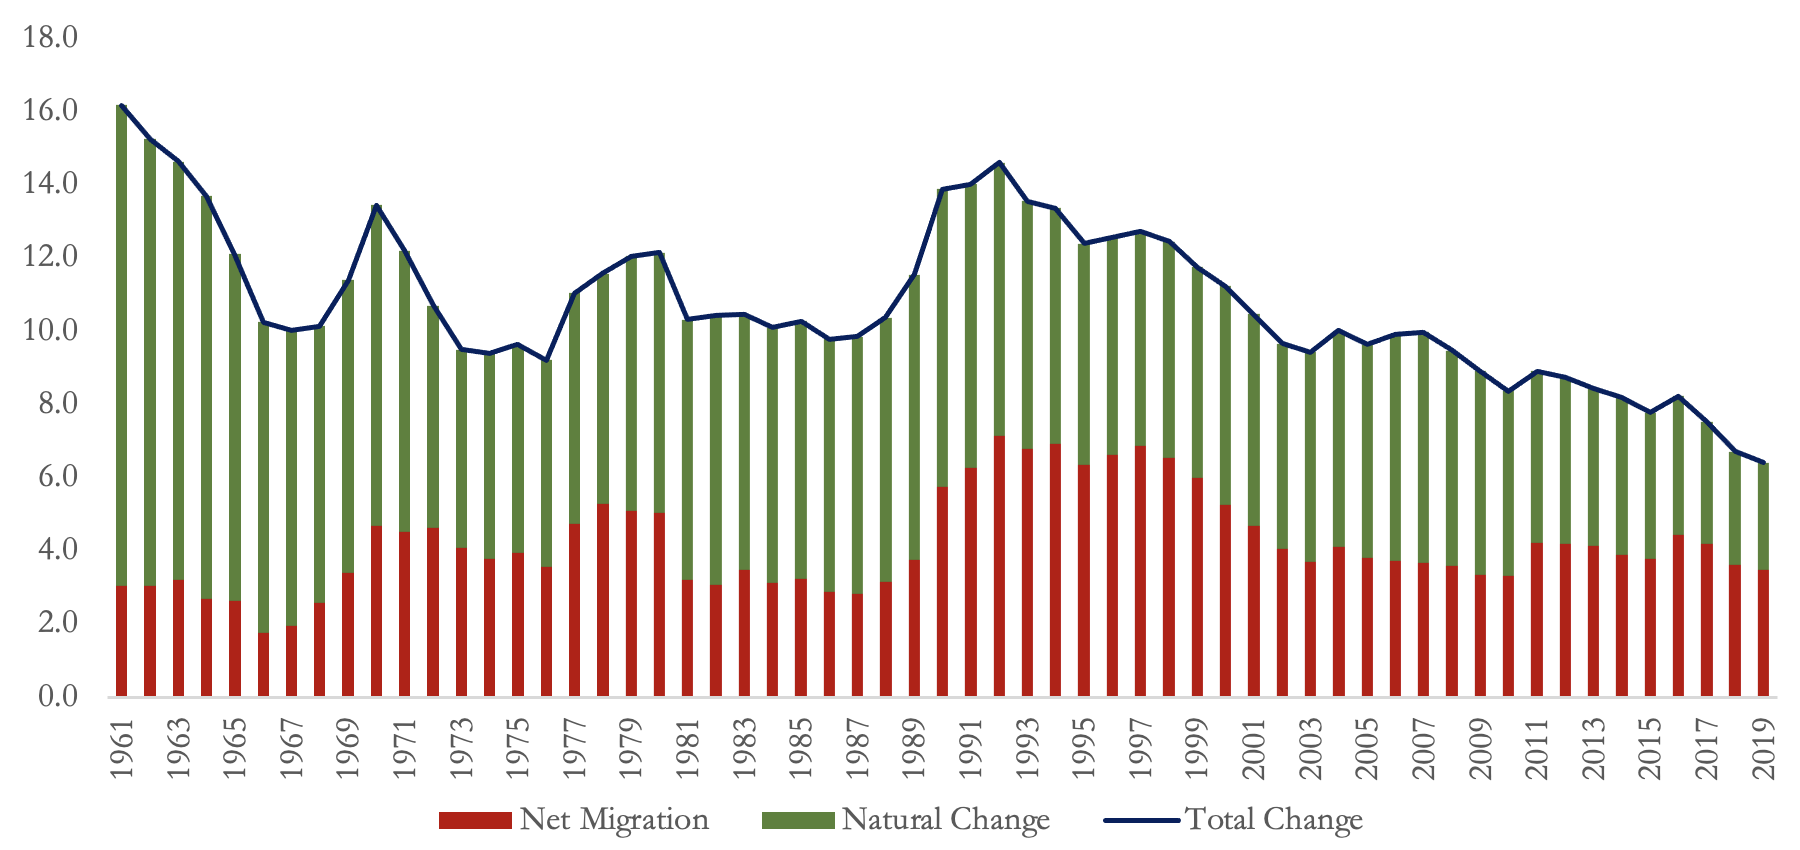
Source: United Nations 2022 World Population Prospects.
Figure 4 below summarizes the key U.S. population dynamics in 2019. Countries and regions studied in previous articles of this series (European Union (EU), Japan, and China), as well as the World average, are added for reference. Although not as extreme as in Japan and the EU, the U.S. has low fertility relative to global standards. In 2019, the U.S. fertility rate stood at 1.7 births per woman, lower than a global average of 2.4 births per woman. Moreover, the birth rate was also lower at 11.3 per 1000, while the death rate was at 8.3 per 1000, owing to a positive natural change rate of 3.0 per 1000. The U.S. is also among the countries with the highest net migration rate, which stood at 3.5 per 1000 in 2019, higher than 3.2 in the EU.
Figure 4 – Key Population Demographics in the U.S., 2019
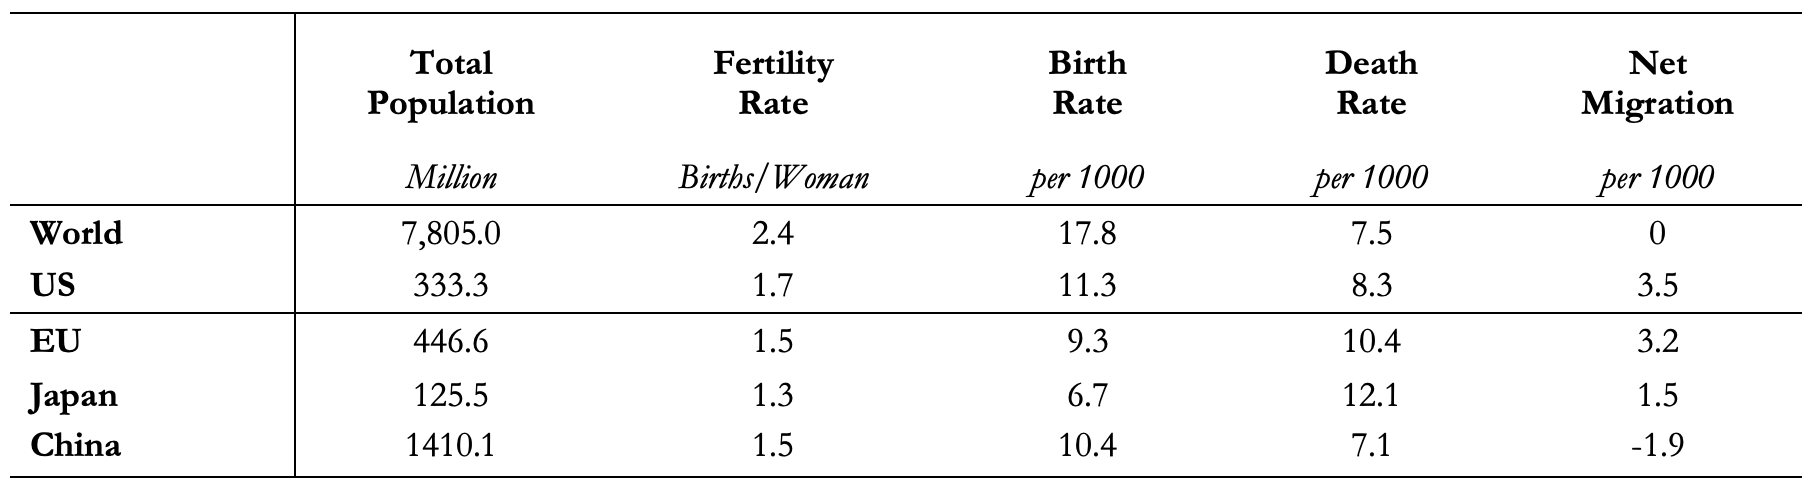
Source: United Nations 2022 World Population Prospects.
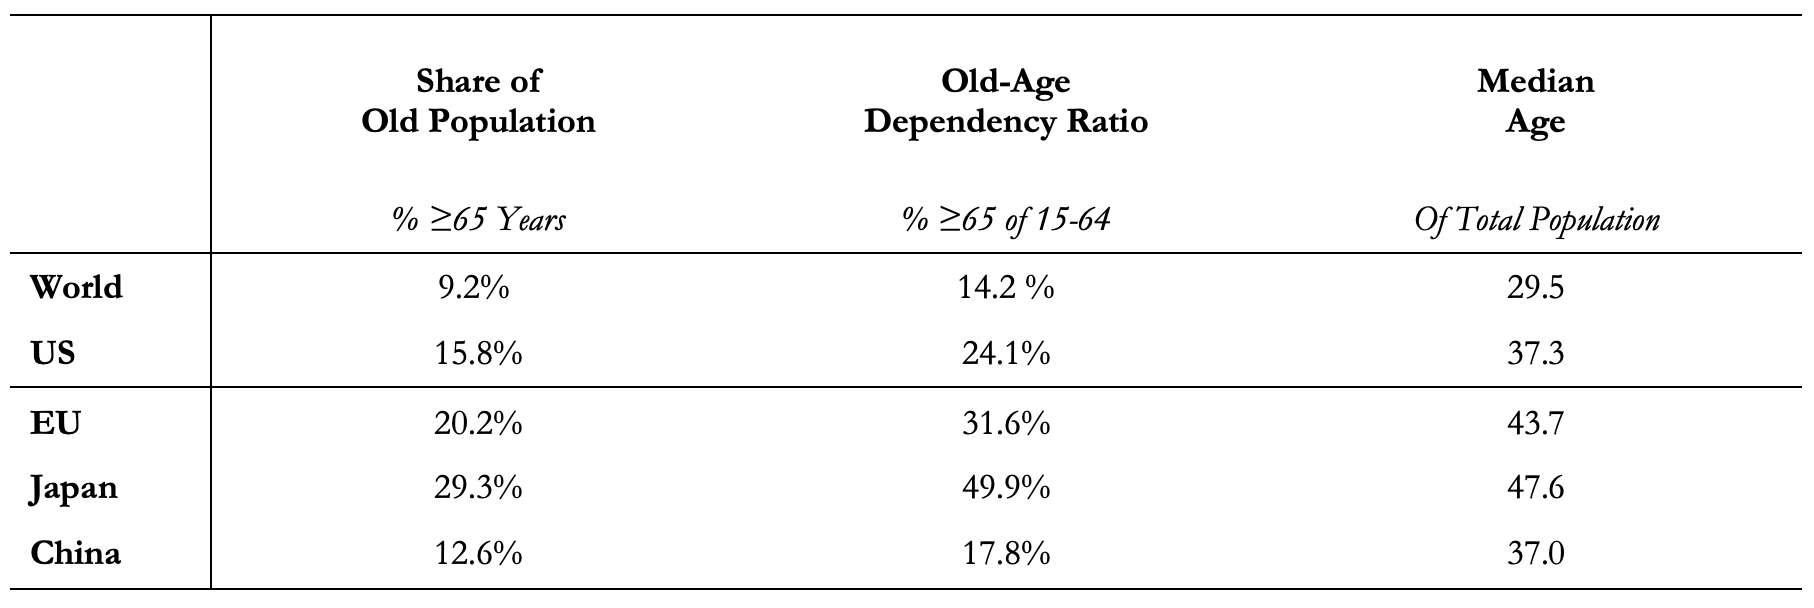
Looking at the age demographics (Figure 5), almost 15.8% of the U.S. population were 65 years or older in 2019, higher than the 9.2% global average, yet lower than the EU and Japanese shares. Moreover, the median age in the U.S. was around 37.3 years, above 29.5 years globally.
Figure 5 – Key Population Age Demographics in US, 2019
Source: United Nations 2022 World Population Prospects.
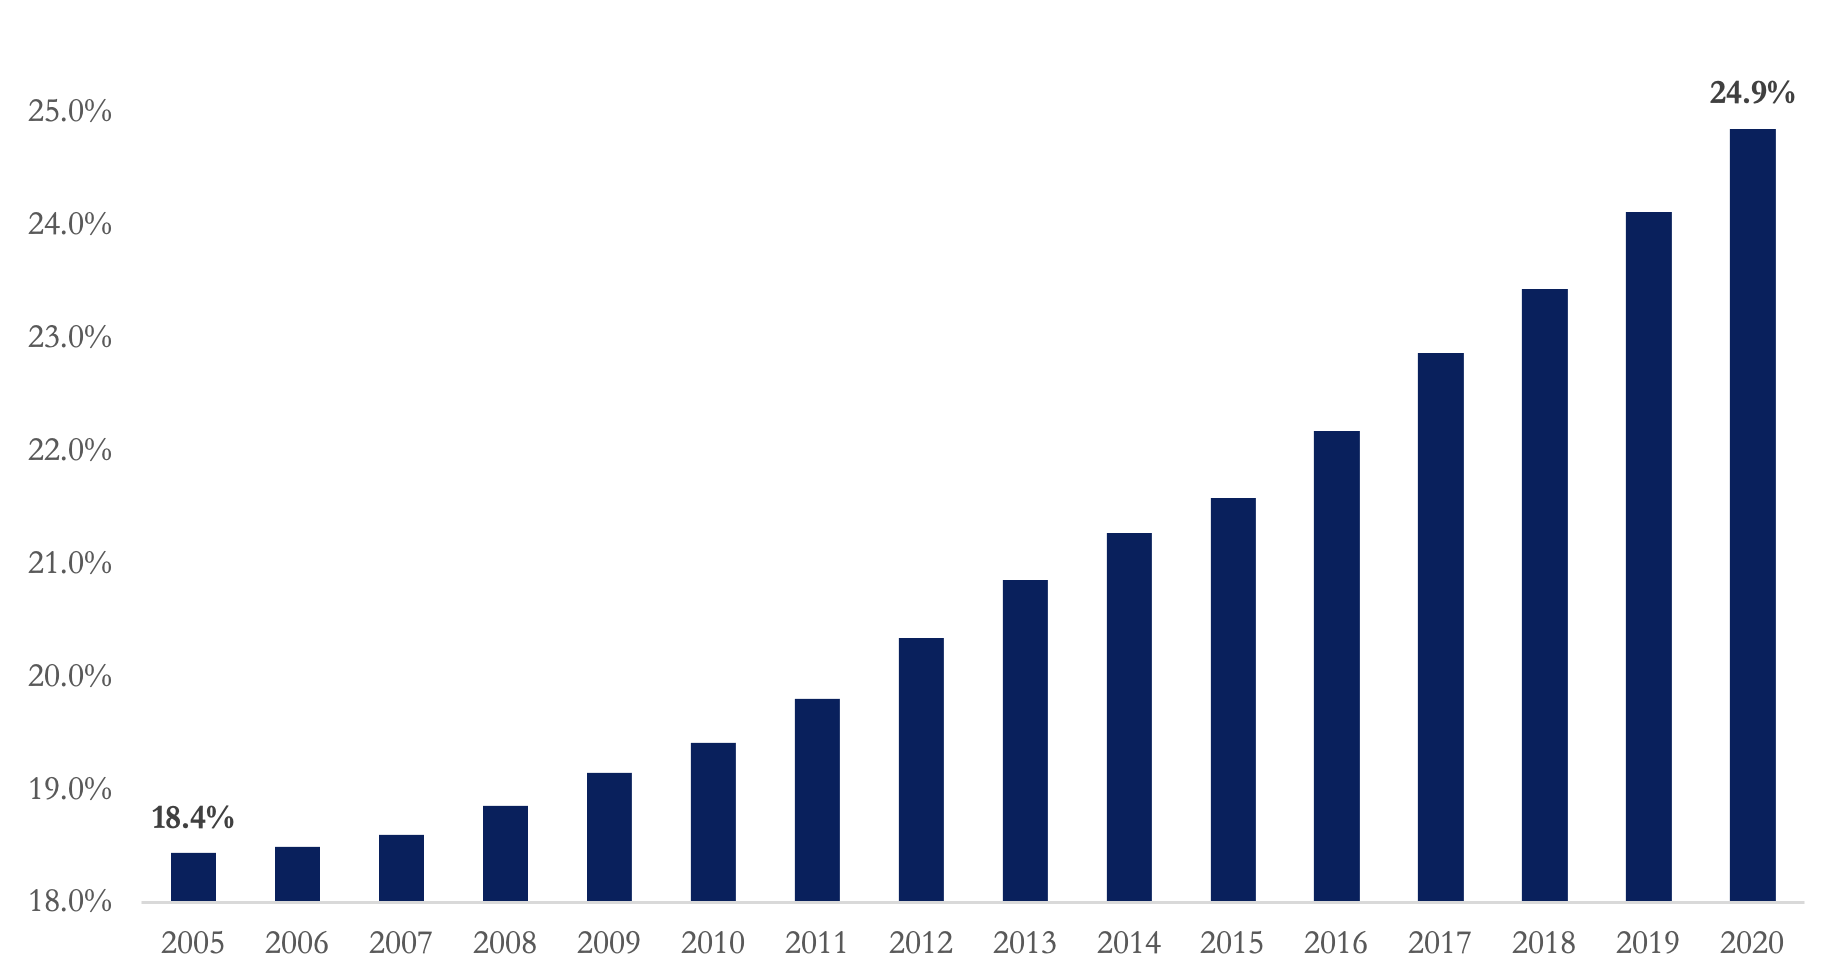
The old-age dependency ratio in the U.S., defined as the percentage of those 65 years and above to the working-age population between 15 and 64 years, stood at around 24.9% in 2019 compared to 14.2% globally, while still lower than in the EU and Japan. The U.S. old dependency ratio has in fact been rapidly increasing over the years, from 18.4% in 2005 to 24.9% by the end of 2019 (Figure 6).
Figure 6 – A Rising US Old-Age Dependency Ratio, %
Source: United Nations 2022 World Population Prospects.
What was Really Driving the Collapsing Growth Prior to the Pandemic?
This is the question on the minds of many economists and business leaders. While the COVID-19 crisis certainly didn’t help matters, the fact is that population dynamics in the United States had been trending towards stagnation long before the outbreak. The outbreak merely accelerated the decline.
First, a declining natural change rate has been the primary factor behind the declining population growth. Other than the classic high-income low fertility rate, the U.S. has been characterized by a relatively high death count, even prior to the pandemic. In fact, the U.S. has one of the lowest life expectancies among high-income countries, at 79 years, compared to 81 in the EU, 82 in the United Kingdom, and 85 in Japan (Figure 7).
Figure 7 – Life Expectancy in High-Income Countries, Years, 2019

Source: The World Bank World Development Indicators and the United Nations 2022 World Population Prospects.
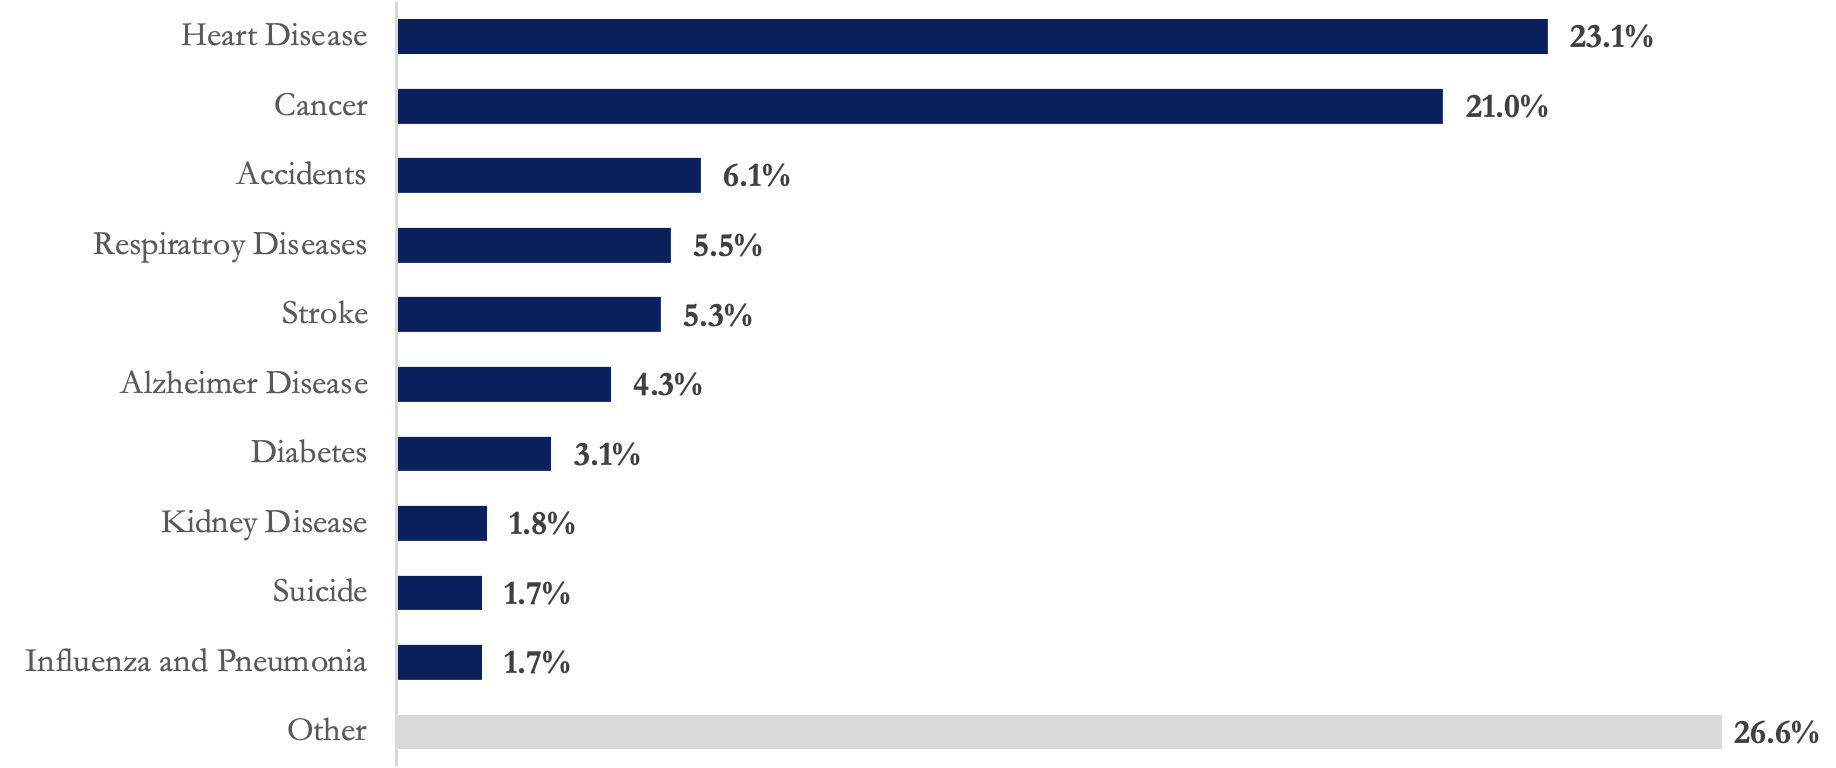
In 2019, almost three million Americans died, with leading causes including heart disease, cancer, accidents, strokes, suicide, and other chronic diseases such as diabetes, respiratory, and kidney diseases (Figure 8). Moreover, the number of deaths among the young is relatively high in the U.S. Accidents, for example, drug overdose deaths, have grown almost 6-fold between 1999 and 2019, reaching 62.2 thousand, with the fastest growth being among those 45-44 years old. Moreover, gun violence, car accidents, heart disease and other health-related deaths, and suicides, are worse in the U.S. than in most comparable high-income countries.
Figure 8 – Leading Causes of Deaths in the U.S., 2019
Source: National Center for Health Statistics retrieved from PBS.
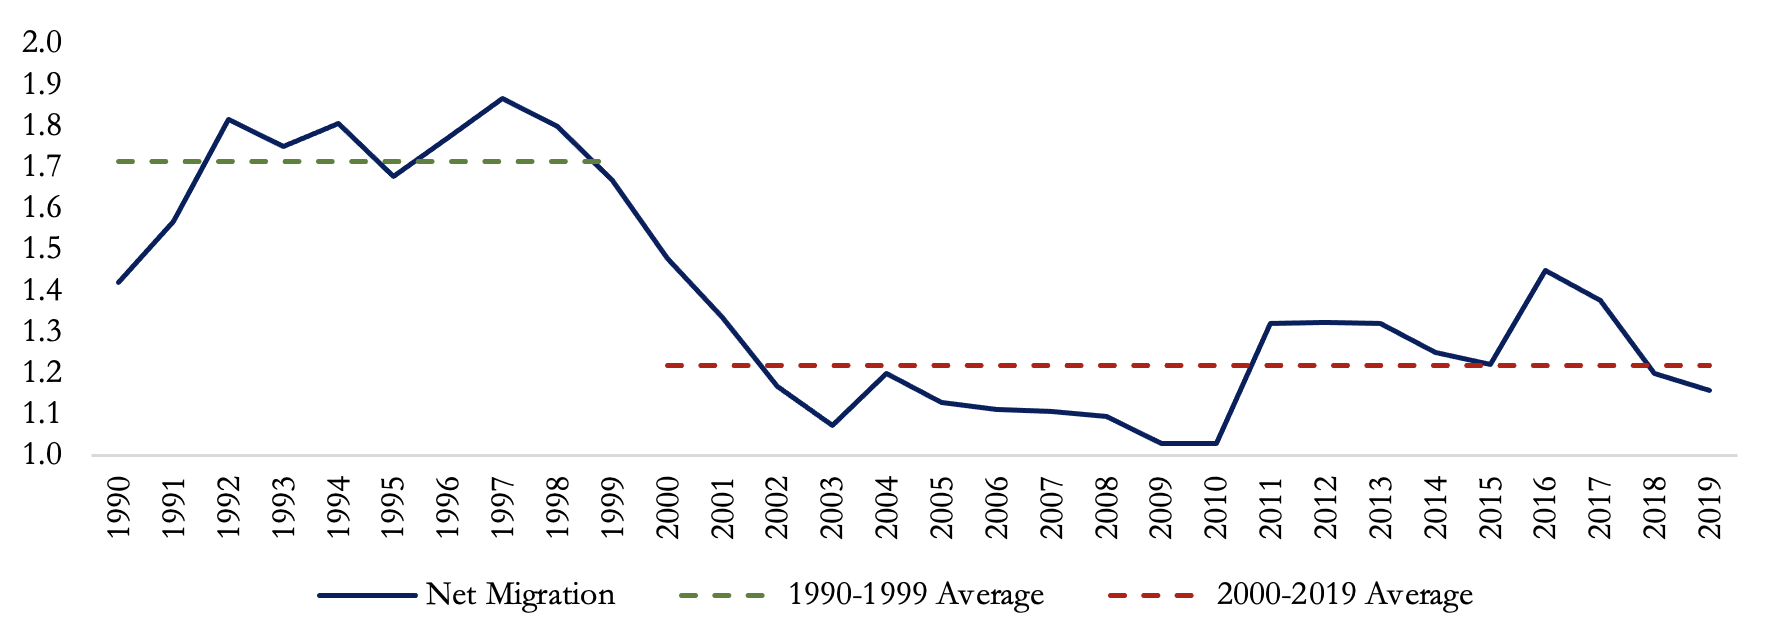
Second, on average net migration has generally dropped in recent years (Figure 9). While the average number of net migrants (immigrants minus emigrants into and out of the U.S.) was 1.7 million between 1990 and 1999 (dashed green line), it dropped to 1.2 million between 2000 and 2019 (dashed red line). Historically, positive and net migration has been a major factor feeding population growth as explained above. Although net migration seemed to be recovering in the second half of the 2010s, this trend reverted, with net migrants dropping by 20% between 2016 and 2019, primarily due to restrictive immigration policies and a more stringent visa regime introduced by the Trump administration..
Figure 9 – U.S. Declining Net Migration, 1990-2019
Source: United Nations 2022 World Population Prospects.
Population Demographics During and After the Pandemic
The COVID-19 pandemic had a profound impact on population demographics in the United States, with significant changes observed during and after the pandemic. The U.S. was among the countries most affected by the COVID-19 pandemic, with an estimated one million pandemic-related deaths during 2020 and 2021 according to the Centers for Disease Control and Prevention (CDC). Although the population continued to increase during the pandemic years, as shown in Figure 10, population growth rates were historically low. The total population increased by an average of 0.31% during 2020 and 2021, almost half the 0.64% growth in the previous year.
Figure 10 – U.S. Population During and After the Pandemic, Jan 2015 – Jan 2022, Millions
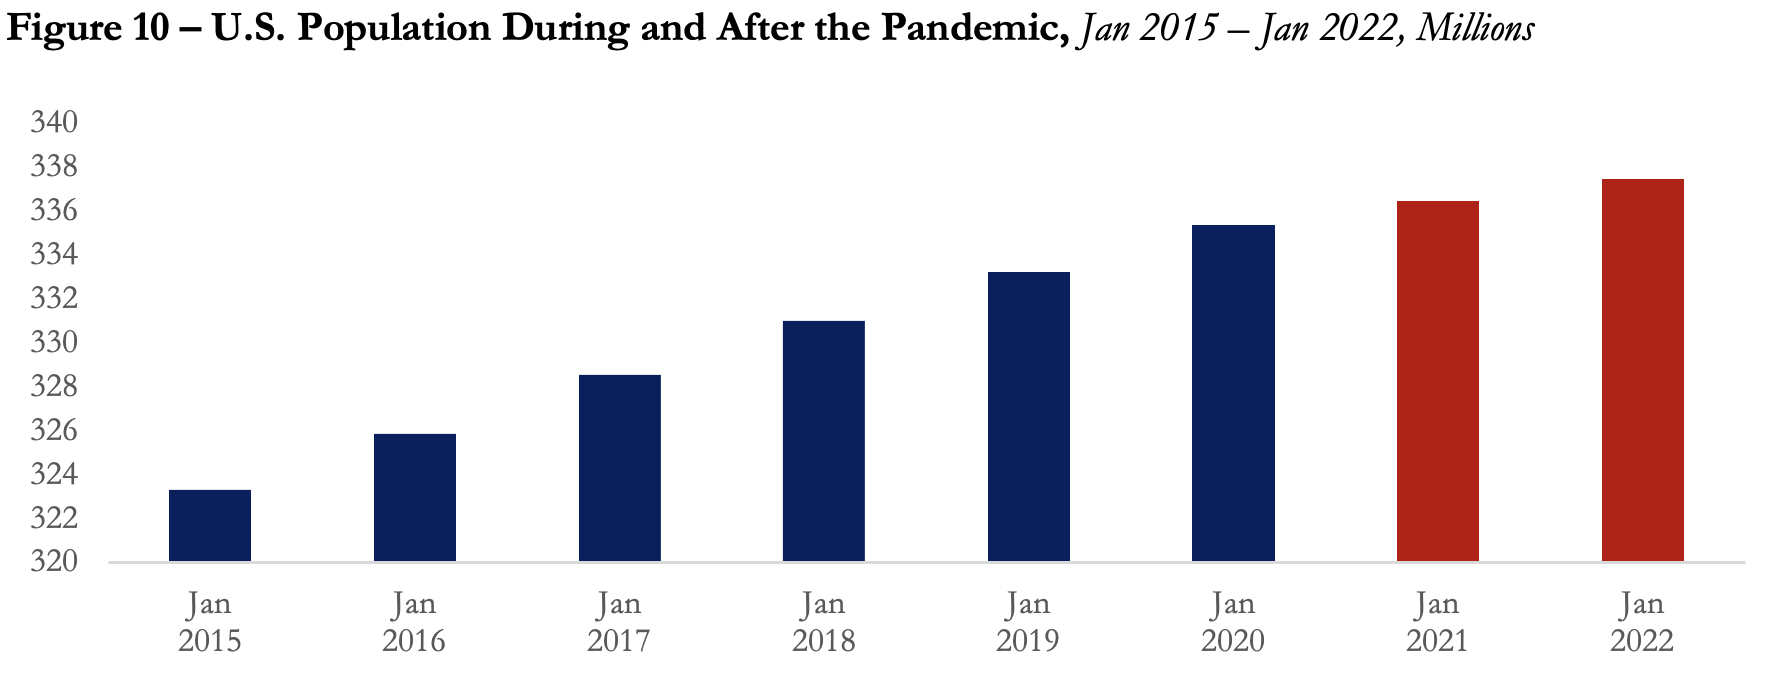
Source: United Nations 2022 World Population Prospects.
As shown in Figures 11 and 12, there were a total of 3.23 million deaths in 2020, almost 460 thousand higher than in 2019. Deaths in 2021 were also high at 3.28 million, for a total number of deaths of 6.52 million during 2020-2021. Moreover, due to reduced mobility brought about by the pandemic and lockdowns, net migration dropped to 676 thousand and 562 thousand in 2020 and 2021, respectively, almost half the number in 2019. As a result, the U.S. population nearly flatlined in 2021, with a record low population growth of 1 million in 2021.
Figure 11 – Population Changes by Component During the Pandemic, Thousands
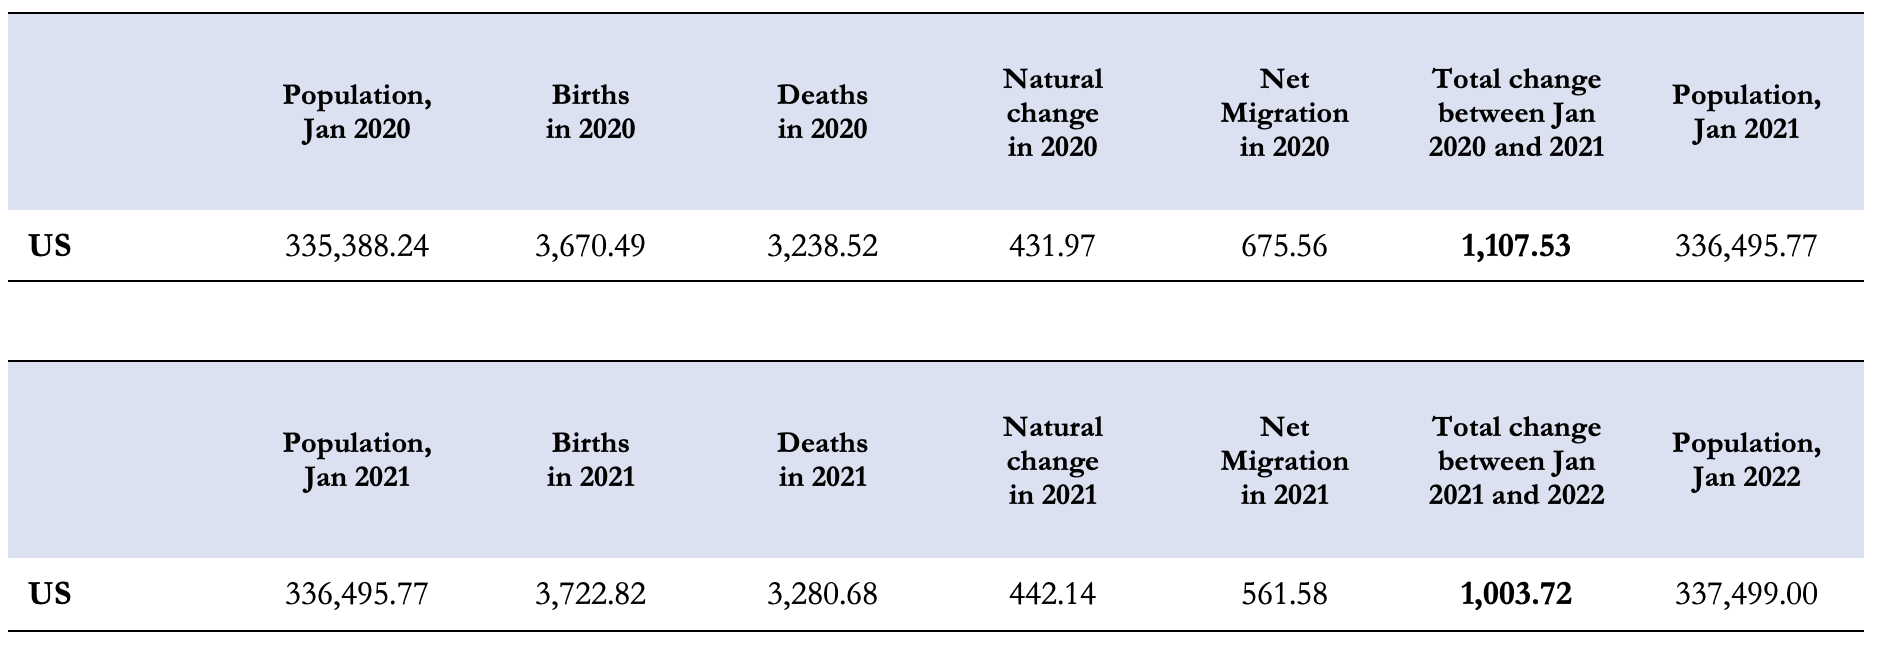
Source: United Nations 2022 World Population Prospects.
Figure 12 – Population Changes by Component During the Pandemic, Thousands
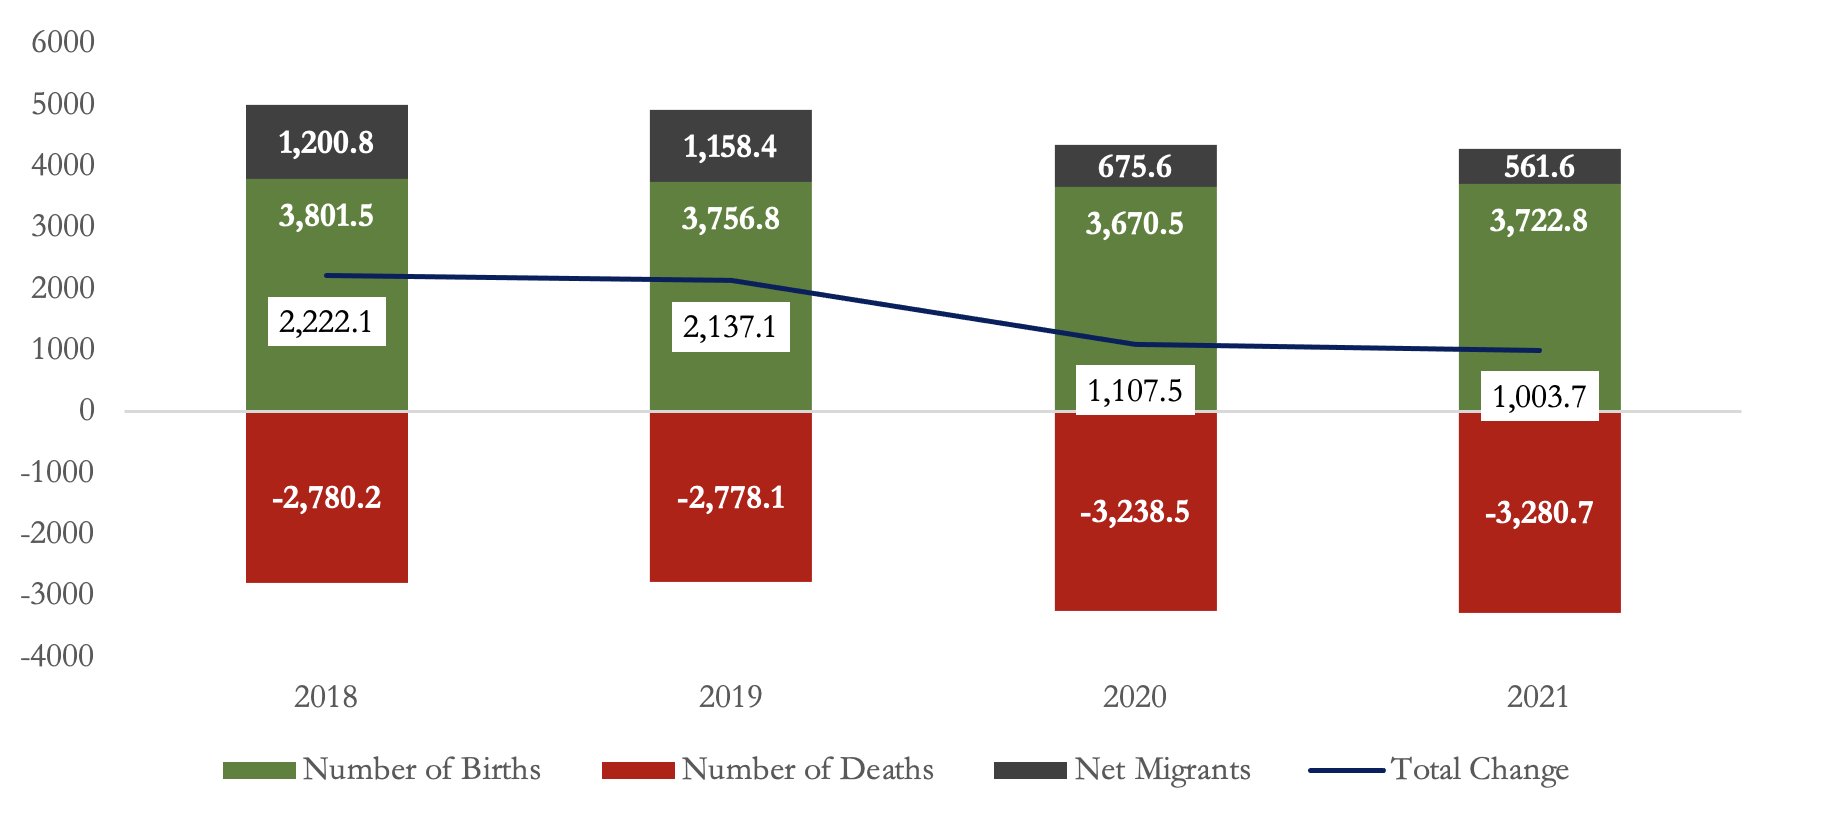
Source: United Nations 2022 World Population Prospects.
The good news is that, in 2022, the U.S. resident population increased by 0.4%, or 1,256,003, to 333,287,557 in 2022, according to the U.S. Census Bureau’s Vintage 2022 national and state population estimates and components of change. “Net international migration — the number of people moving in and out of the country — added 1,010,923 people between 2021 and 2022 and was the primary driver of growth. This represents 168.8% growth over 2021 totals of 376,029 – an indication that migration patterns are returning to pre-pandemic levels. Positive natural change (births minus deaths) increased the population by 245,080.” This is the largest year-over-year increase in total births since 2007. Whether this baby boomlet can be repeated is a critical factor for economic growth but is unknown.
Future Population Demographics: Looking Forward to 2050
Looking forward to 2050, the population dynamics of the United States are set to undergo significant changes, with far-reaching implications for the economy and society as a whole. According to future population projections by the UN World Population Prospects, the U.S. population growth is expected to remain positive, although with an increasingly flatlining population (Figure 13). Population growth is projected to average 0.50% between 2023 and 2030, recovering from the low pandemic figures, yet lower than the pre-pandemic growth rate. Growth is then projected to continuously decline to an average of 0.33% between 2030 and 2050, and almost zero at an average of 0.04% in the 10 years leading to 2100. Total population will stand at 375.1 million in 2050 and 394.0 million in 2100.
Figure 13 – Future U.S. Population, 2022 –2100, Millions
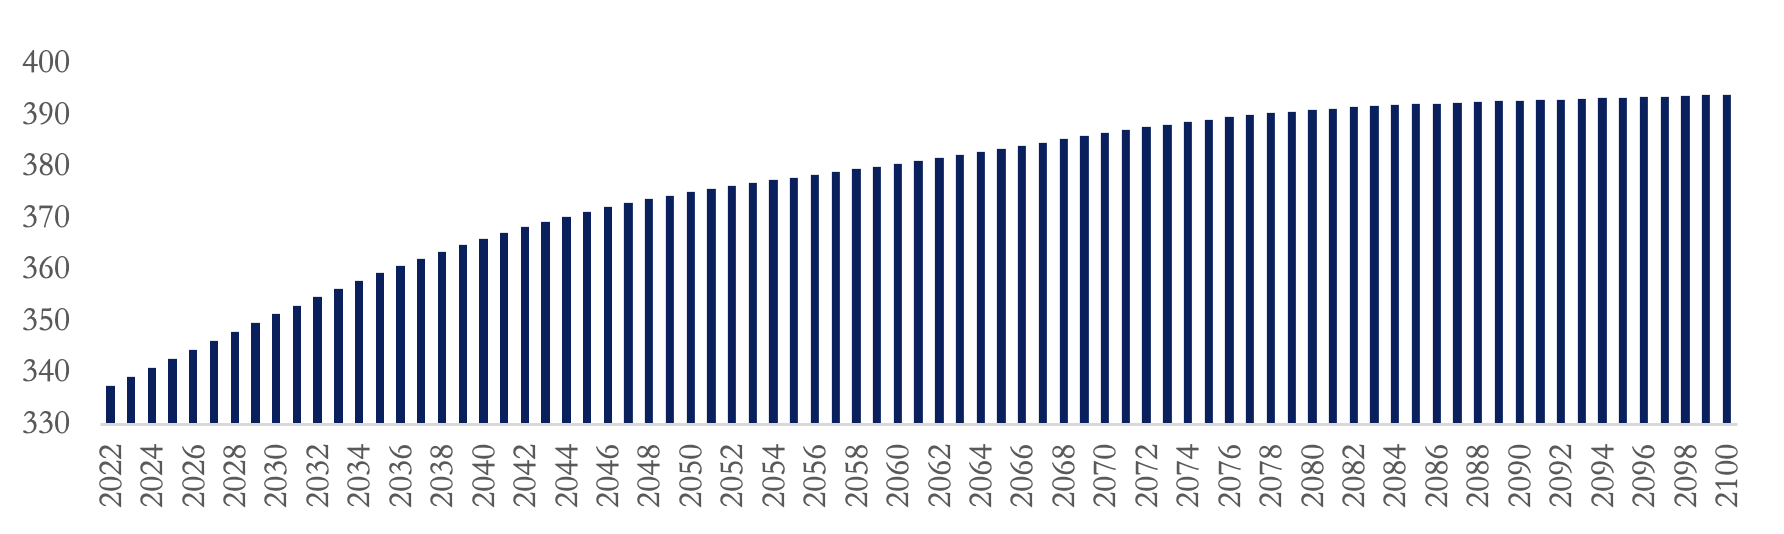
Source: United Nations 2022 World Population Prospects.
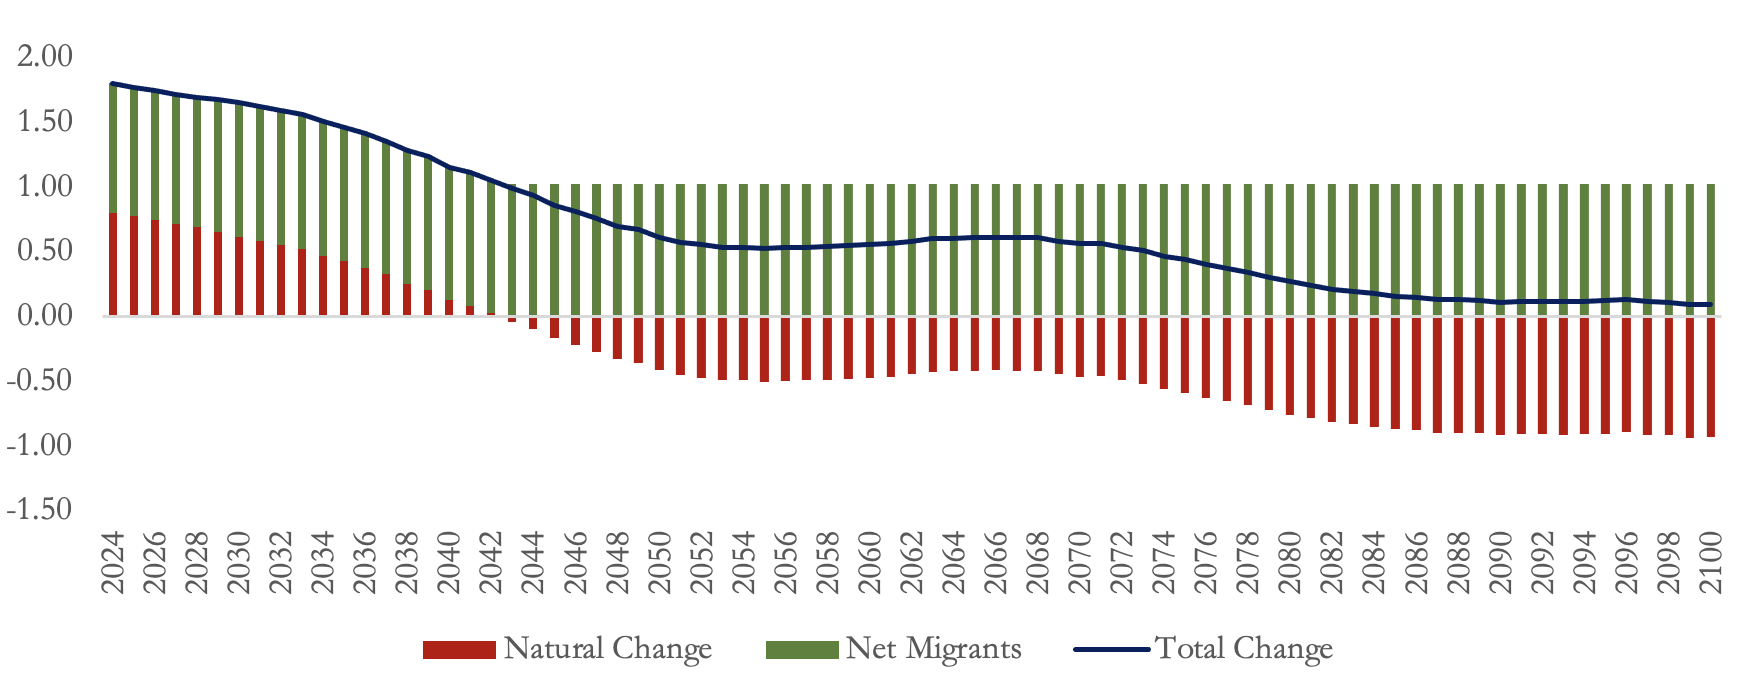
What makes the U.S. so different from other countries with aging populations is the relatively higher net migration. In fact, such a positive population growth rate is conditional on the assumption of a steady and high net migration. While in most of the aging countries, populations have already peaked or will soon do so, with population growth rates in the negative territory, the U.S. population growth is expected to remain positive. As shown in Figure 14, while the natural population change is expected to turn negative in the early 2040s due to the aging out of Baby Boomers, as the number of deaths surpasses the number of births, the high and steady net migration will become the sole positive force pushing up the population. However, moving forward, as the negative natural change increases in magnitude, the population will flatline, with net migration and natural change almost exactly offsetting one another.
Figure 14 – Future U.S. Population Change by Component, 2022 –2100, Millions
Source: United Nations 2022 World Population Prospects.
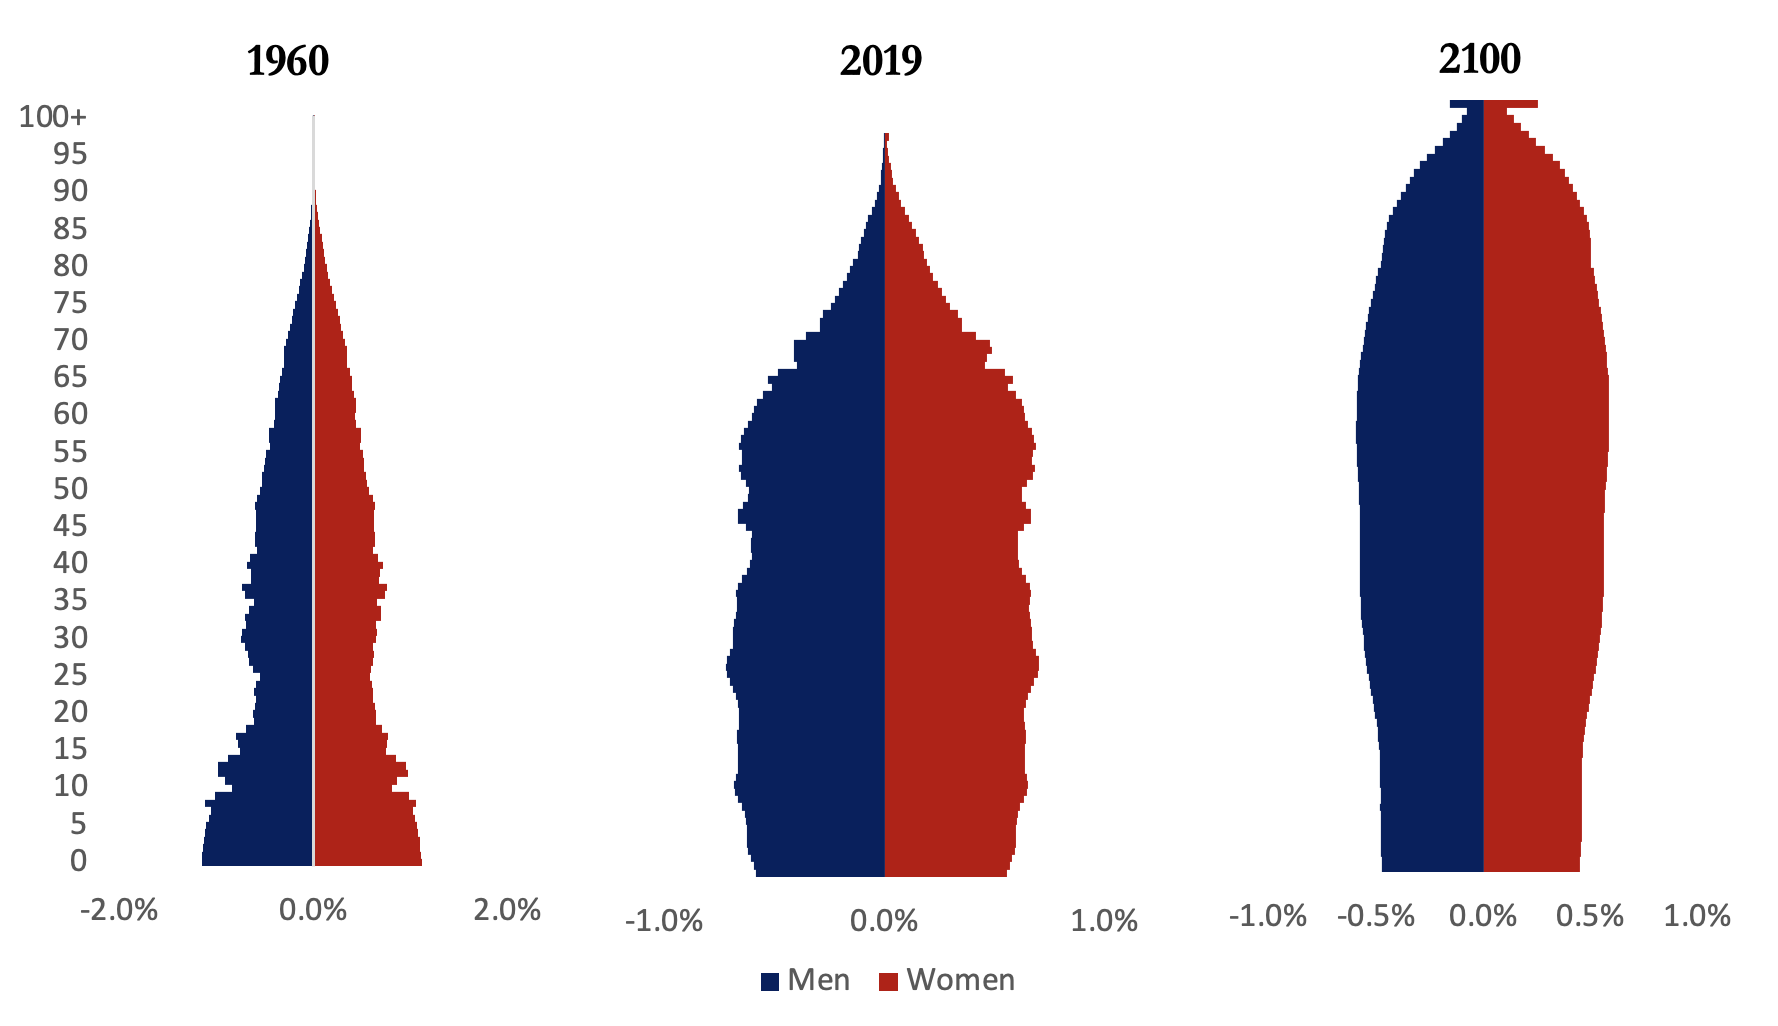
Looking at the evolution of the U.S. population pyramids over time (Figure 15), similar to other countries with aging populations, moving forward the pyramid will be characterized by a broadening top as the society ages. However, comparing the U.S. pyramid to other countries such as Japan or the EU (covered in previous articles of this series), one thing will obviously be different: by 2100, population distribution will be very much evenly distributed between the different ages, as depicted by a very straight tower-shaped pyramid.
Figure 15 – U.S. Population Pyramids, 1960, 2019, and 2100, % Total Population
Source: United Nations 2022 World Population Prospects.
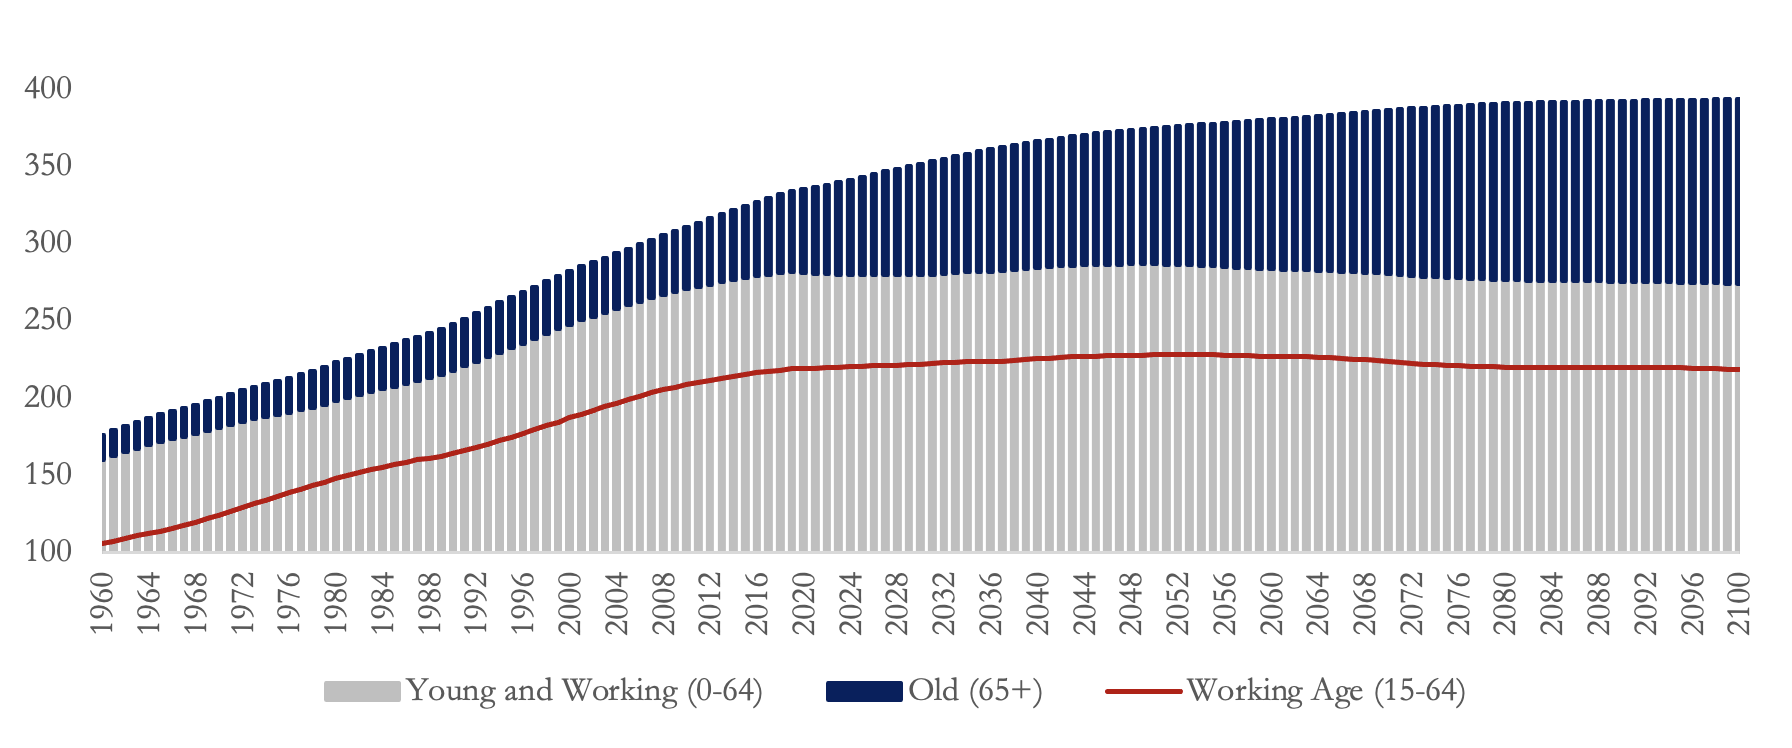
The reason behind this uniqueness will be a relatively flat working-age population, fueled by a steady number of immigrants, as opposed to declining working-age populations in other aging countries (Figure 16).
Figure 16– U.S. Population by Age Groups, 1960-2021, Millions
Source: United Nations 2022 World Population Prospects.
What This Means for the U.S. Economy and Can It Be Mitigated?
The United States’ nearly stagnant population growth and changing demographics have significant implications for the economy and the country’s ability to maintain its position as a global economic leader. The decline in population growth and aging of the population will have a profound impact on the labor force and workforce development. With a shrinking pool of young workers available to replace retiring baby boomers, the U.S. faces economic and fiscal challenges.
Unlike other countries with aging populations and declining working-age populations, the U.S. working-age cohort has remained relatively stable, as explained above.While the country does not face the same challenge of a rapidly shrinking labor force, it remains highly dependent on immigrants to replenish the working-age population. Without a steady inflow of working immigrants, the U.S. could easily fall into the same declining population trap as the EU or Japan. The major difference between those countries and the United States is that migrants, highly educated or not, still pursue living here. The belief of better job opportunities, better life for their families and better religious freedoms are amongst the top drivers of the desire to live in the United States.
To maintain the current level of population without relying on migration, the U.S. would need a fertility rate of approximately 2.1 births per woman, compared to the current rate of around 1.7 births per woman. This presents a significant challenge for policymakers and underscores the importance of policies that promote fertility and support working-age immigration.
To mitigate the impacts of a slowing population, a first step would be to implement policies that could boost the fertility rate. Several of such policies have been applied in other countries and discussed in the previous three articles of this series. Those can include pronatalist policies, such as providing financial incentives for parents to have children, contributing to the education and health expenses of children, providing more affordable childcare, and enforcing more generous maternity and paternity leaves. However, the impact of such fertility-boosting policies has in general been only moderate in other countries.
Accordingly, greater attention should be directed towards increasing labor force participation and improving their skills to improve productivity. Such policies could include more investment in health, education, and automation, especially to improve the productivity of the elderly. Moreover, maintaining a longer retirement age and heavily penalizing early retirements through pension cuts could be key.
Finally, and most politically challenging maintaining a dynamic and vibrant U.S. economy will necessitate allowing for more foreign-born skilled workers. As a result, sound immigration policy reform is critical. According to the International Monetary Fund, only positive net immigration can ensure population stability in aging economies such as the U.S. That would not only help with growing the population but also improve the age structure, adding to the working-age cohort and reducing the dependency ratio, which in turn should increase productivity and reduce the pressure on the pensions system. While the scope of fixing a broke US immigration system goes beyond the limits of this paper, one of the key areas to focus on is providing visas for economic reasons and not simply family reunification (the current law from 1965!). Canada and Australia offer excellent examples of developed countries utilizing economic immigration.
Final Thoughts
The population dynamics of the United States have significant implications for the country’s economy, particularly considering the collapsing growth in population. Before the pandemic, population trends and demographics were already shifting, with an aging population and a shrinking pool of young workers to replace retiring baby boomers. The pandemic has further exacerbated these trends, leading to further declines in population growth.
Looking forward to 2050, it’s clear that the U.S. will face significant challenges in maintaining its position as a global economic leader unless something changes. With an aging population and declining growth, the country will need to find ways to replenish its workforce to foster economic growth. This will require a concerted effort from policymakers to promote fertility, support working-age immigration, and invest in workforce development programs. Of these three, immigration is the most powerful and simple solution to the US declining demographic picture.
Despite these challenges, there is reason for optimism. The U.S. has a long history of adapting to changing demographic trends, and there are already signs that the country is taking steps to address the current challenges. With the right policies and investments, the U.S. can mitigate the impact of collapsing population growth and ensure a vibrant and prosperous economy for generations to come. The question remains, can the US political environment change from a myopic nativist view to an economic revivalist view.